| Snowfall Totals | ||||||
|---|---|---|---|---|---|---|
| City | Station | December | January | February | March | Season Total |
| Boston | KBOS | 0.0 | 6.6 | 23.9 | 12.0 | 42.5 |
| New York City | KNYC | 8.7 | 9.2 | 10.7 | 15.9 | 44.5 |
| Philadelphia | KPHL | 7.8 | 3.7 | 16.9 | 13.4 | 41.8 |
| Baltimore | KBWI | 9.5 | 1.5 | 18.3 | 13.7 | 43.0 |
| Washington, D.C. | KDCA | 12.0 | 0.3 | 17.2 | 10.6 | 40.1 |
| Richmond | KRIC | 2.9 | 3.7 | 7.7 | 6.3 | 20.6 |
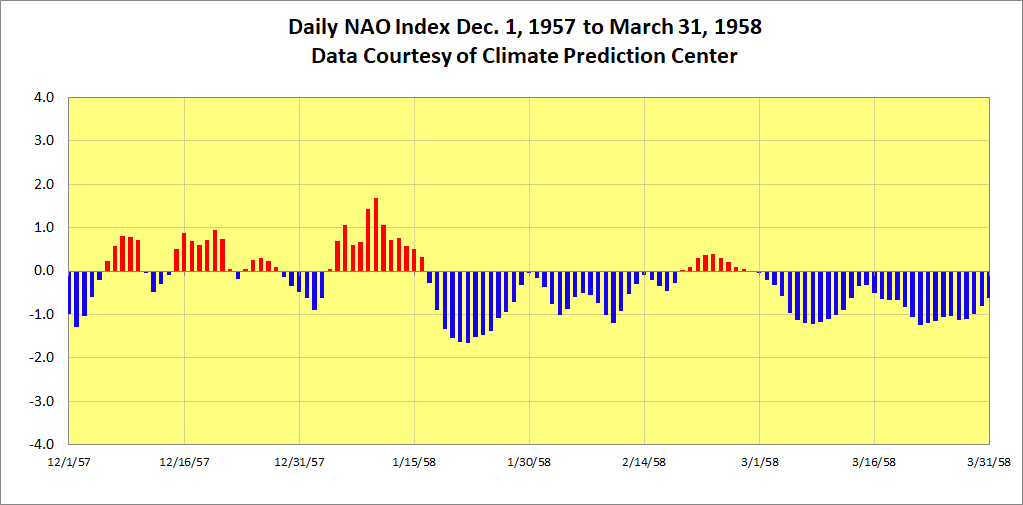
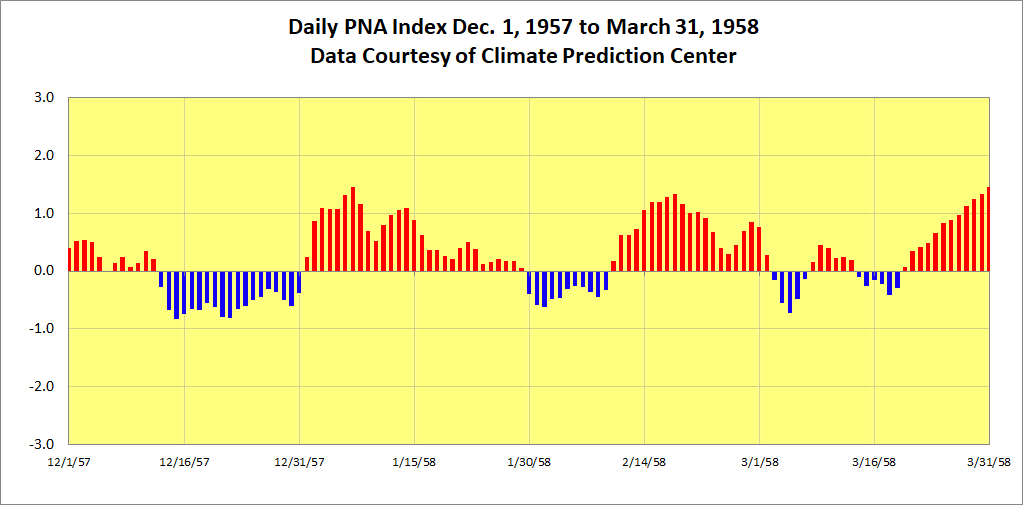
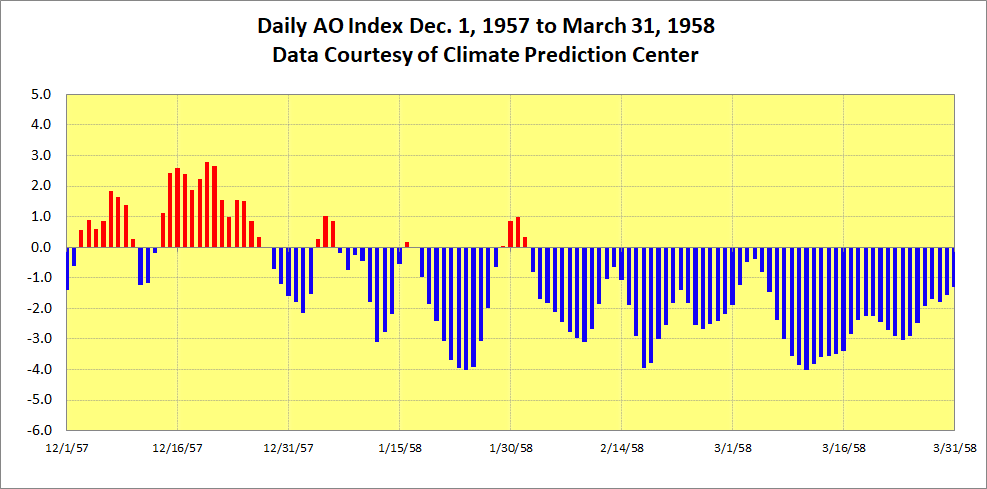
| NAO | PNA | AO |
|---|---|---|
|
|
|
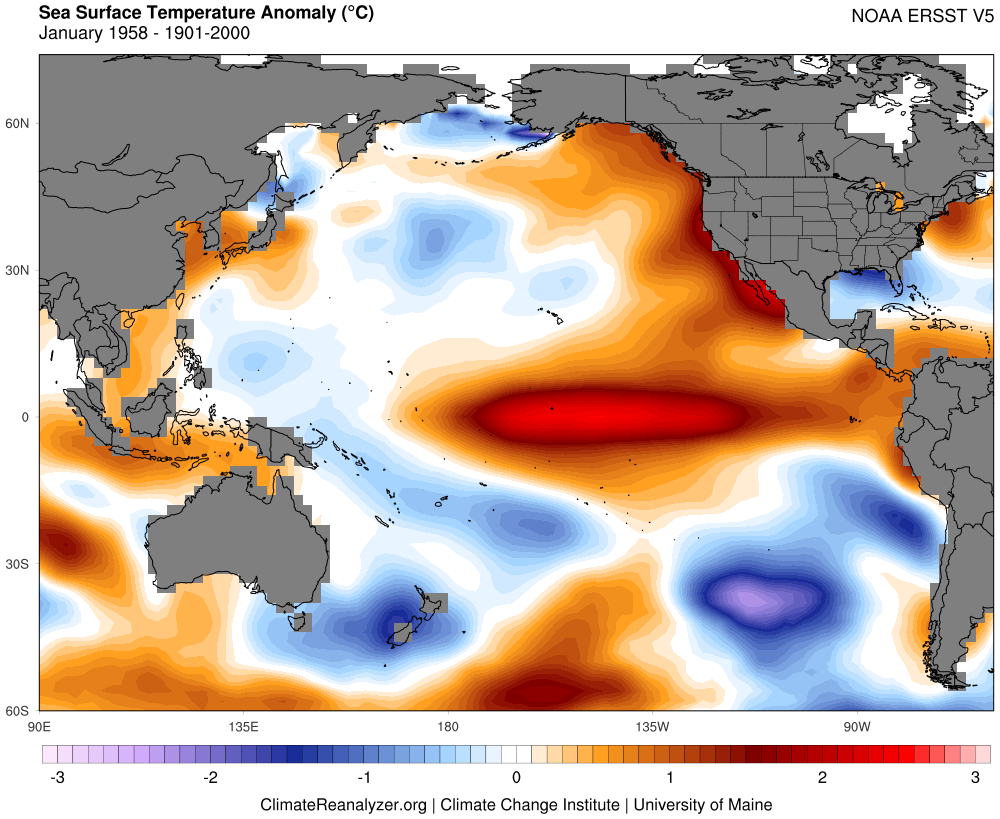
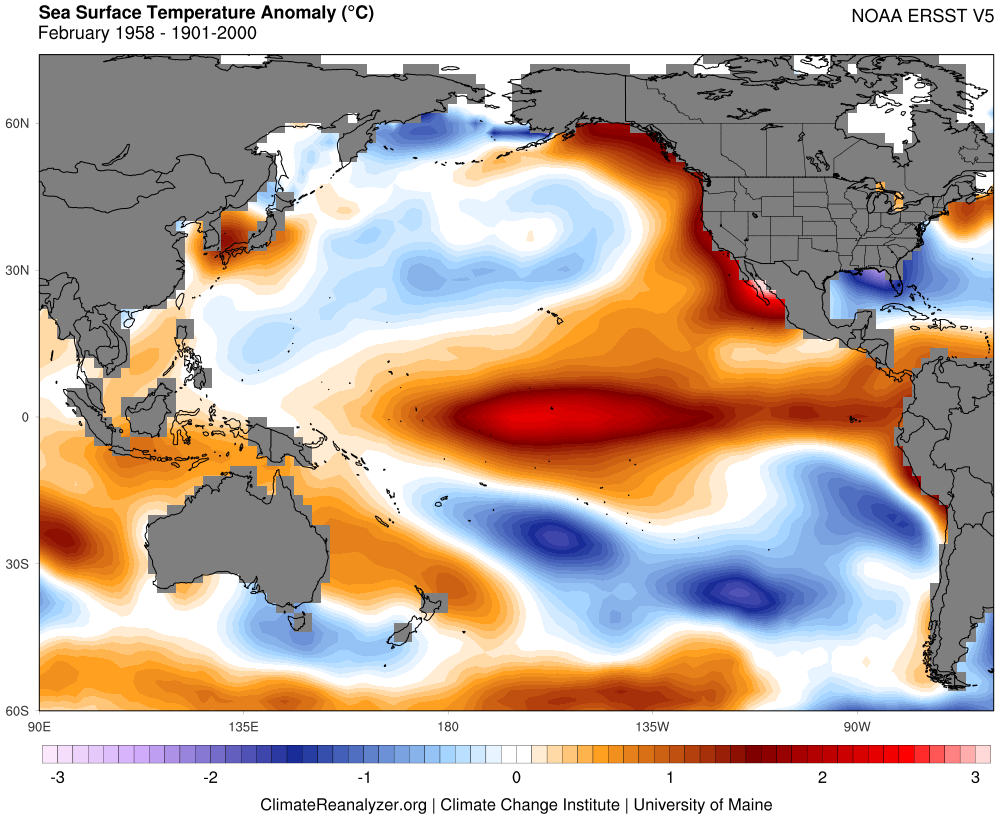
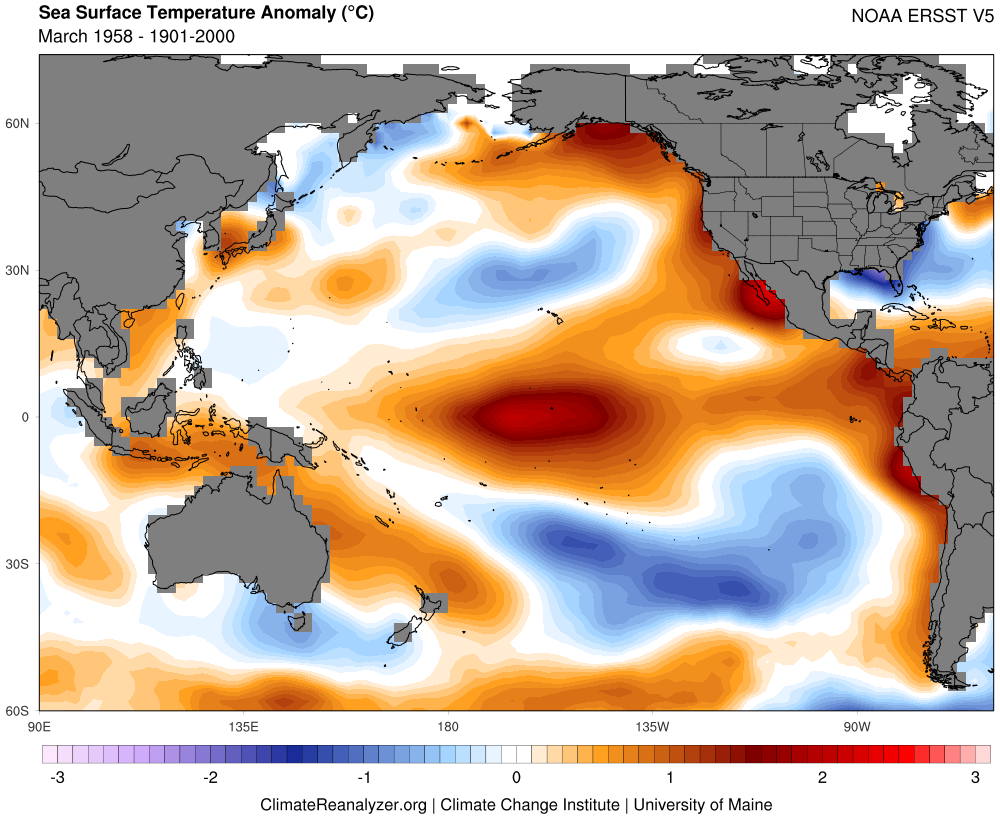
| ENSO Indicies - Monthly(HADISST) | ||||
|---|---|---|---|---|
| Month | Nino 1+2 | Nino 3 | Nino 3.4 | Nino 4 |
| December | 1.09 | 1.16 | 1.18 | 0.62 |
| January | 0.73 | 1.19 | 1.54 | 1.07 |
| February | 0.99 | 0.91 | 1.40 | 1.17 |
| March | 0.86 | 0.56 | 0.99 | 0.97 |
| HADISST values removed 1981-2010 base period | ||||
| Monthly Index Values(ERSST.v5) | ||||
|---|---|---|---|---|
| Month | Nino 1+2 | Nino 3 | Nino 3.4 | Nino 4 |
| December | 0.59 | 1.28 | 1.34 | 0.44 |
| January | 0.16 | 1.29 | 1.78 | 0.81 |
| February | 0.34 | 1.03 | 1.50 | 1.02 |
| March | 0.55 | 0.57 | 1.03 | 0.79 |
| **ERSST.v5 values using 1981-2010 base periods** | ||||
| Historic Nino 3.4/Oceanic-Nino Index Values(ERSST.v5) | |||
|---|---|---|---|
| Month | Nino 3.4 | 3-Month Period | ONI |
| December | 1.71 | Nov/Dec/Jan | 1.74 |
| January | 1.98 | Dec/Jan/Feb | 1.81 |
| February | 1.72 | Jan/Feb/Mar | 1.66 |
| March | 1.26 | ||
| **Anomalies calculated using 30-year climatological values, updated every five years. The updating of base periods removes observed warming trend in Nino 3.4 region. Anomalies generated from CPC** | |||
| Multivariate/Bivariate ENSO Indexes | |||||
|---|---|---|---|---|---|
| Month | MEI | Month | BEST | ||
| Dec/Jan | 1.473 | December | 0.86 | ||
| Jan/Feb | 1.454 | January | 1.67 | ||
| Feb/Mar | 1.313 | February | 1.24 | ||
| March | 0.87 | ||||
| Monthly SOI Index | |||
|---|---|---|---|
| December | January | February | March |
| -3.5 | -16.8 | -6.9 | -1.4 |
| Monthly Index Values | |||
|---|---|---|---|
| NOAA-NCEI | UW-JISAO | JMA-TCC | |
| December | 0.46 | -0.55 | 0.426 |
| January | 0.83 | 0.25 | 0.657 |
| February | 0.94 | 0.62 | 1.106 |
| March | 0.62 | 0.25 | 0.801 |
 |
 |
 |
 |
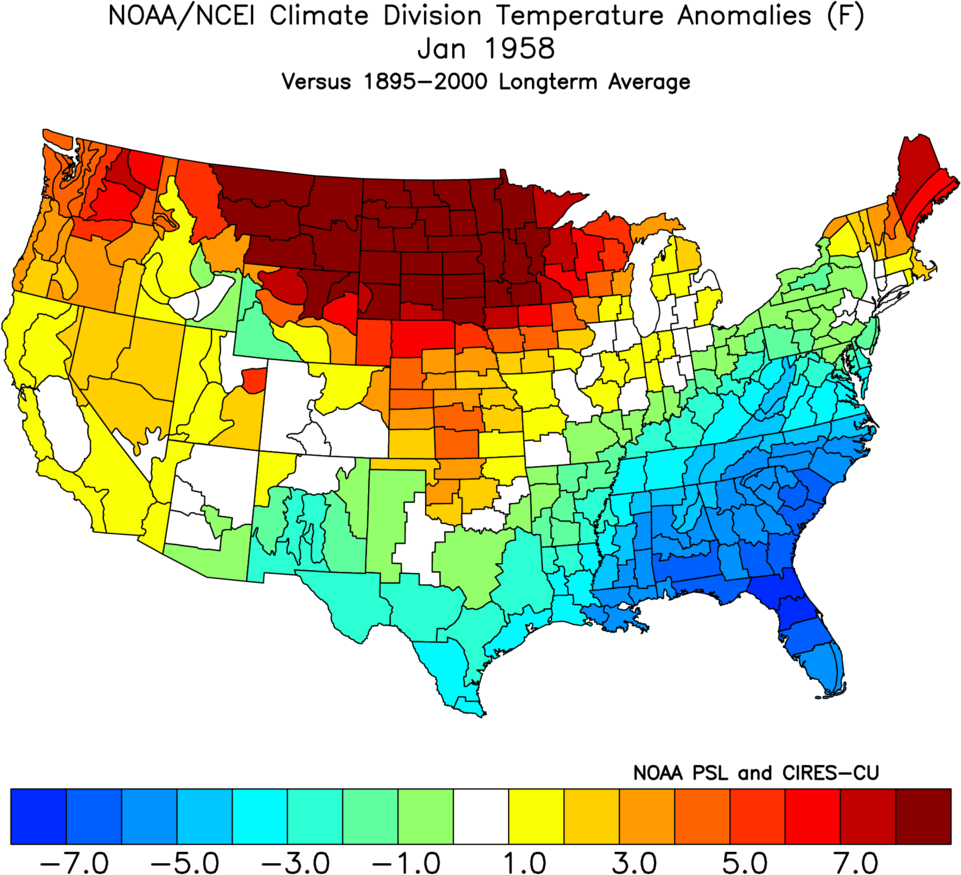
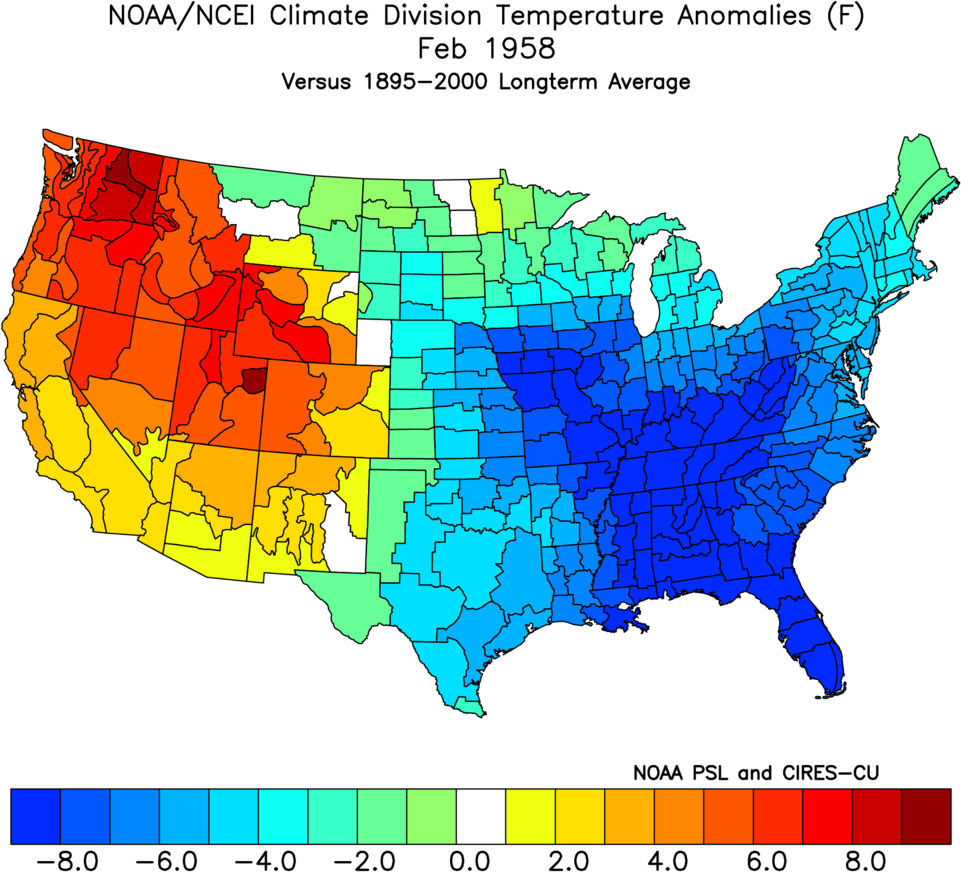
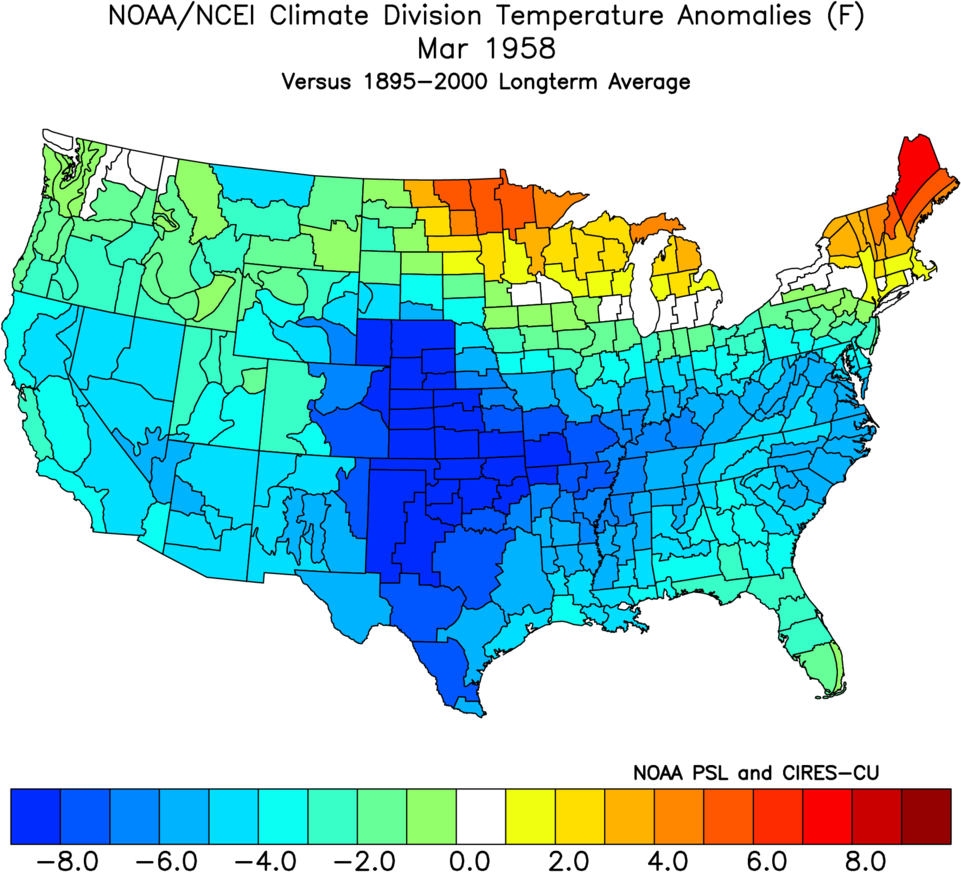
| Monthly Temperature | |||
|---|---|---|---|
 |
 |
 |
 |
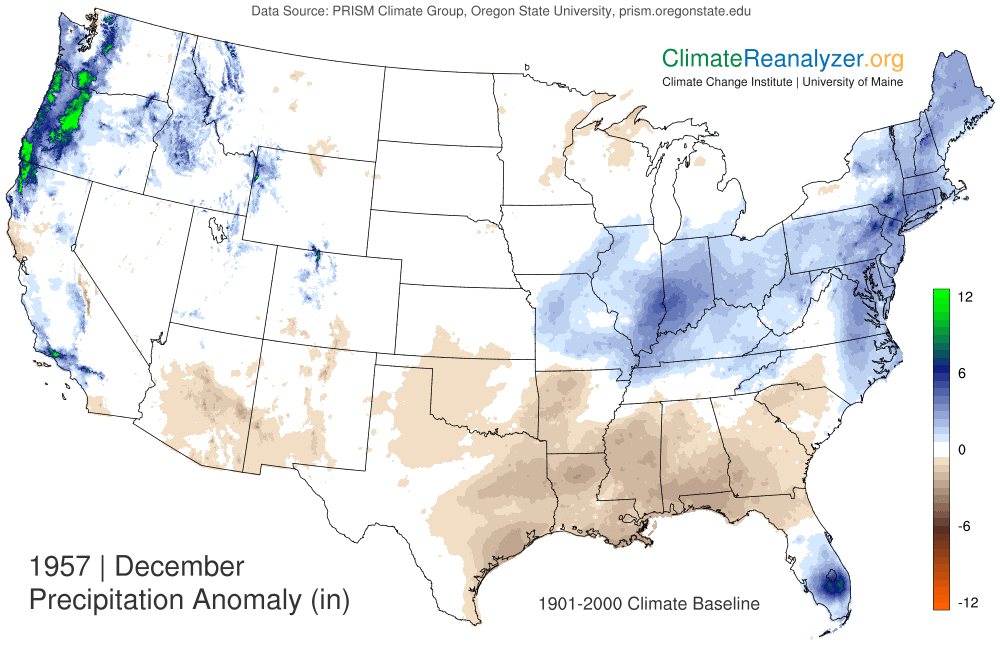
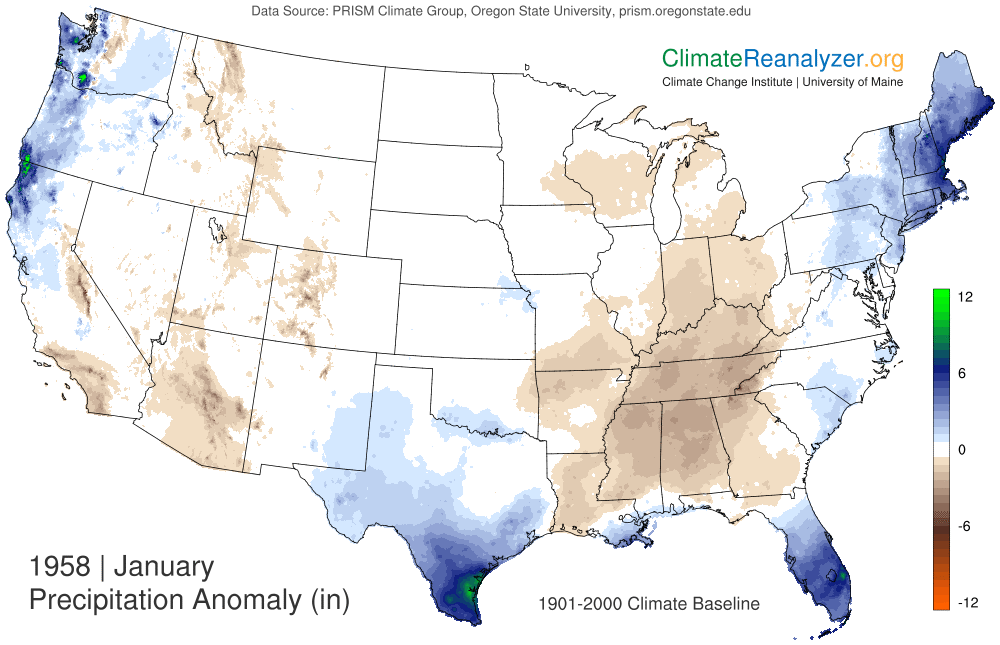
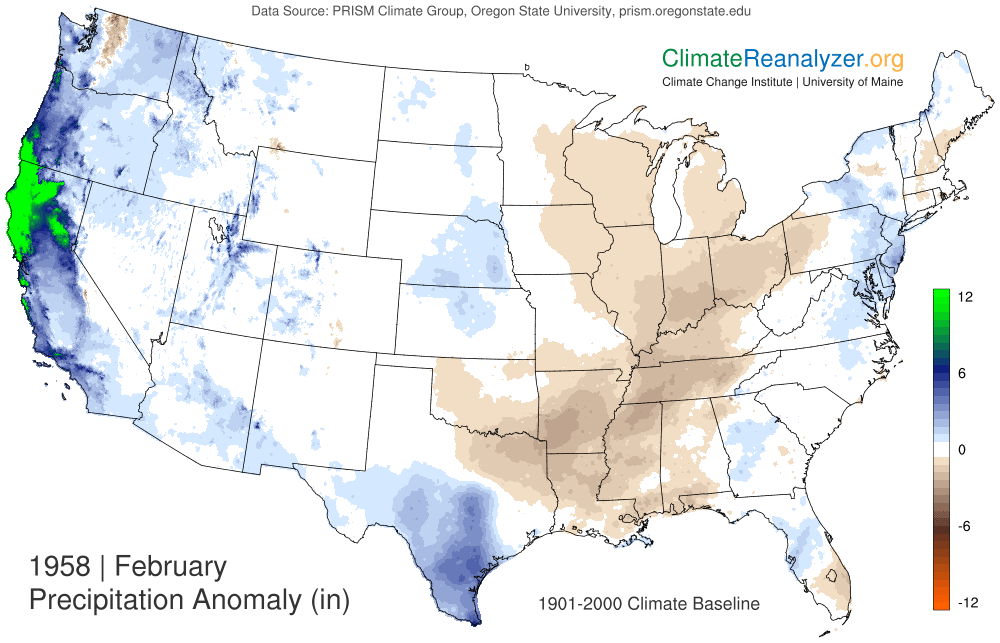
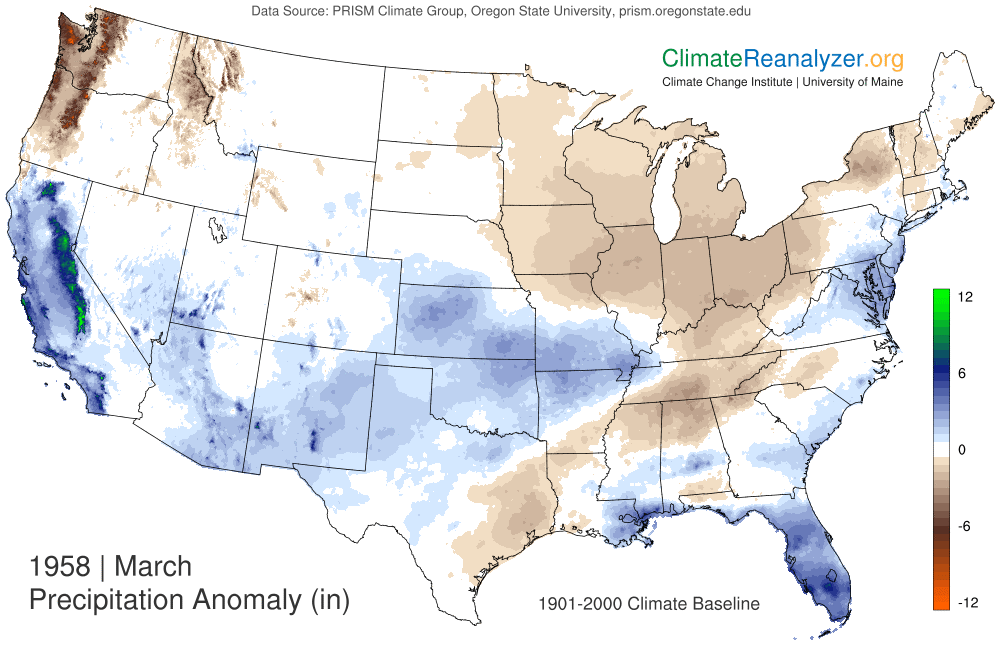
| Monthly Precipitation | |||
|---|---|---|---|
 |
 |
 |
 |
 |
 |
 |
 |