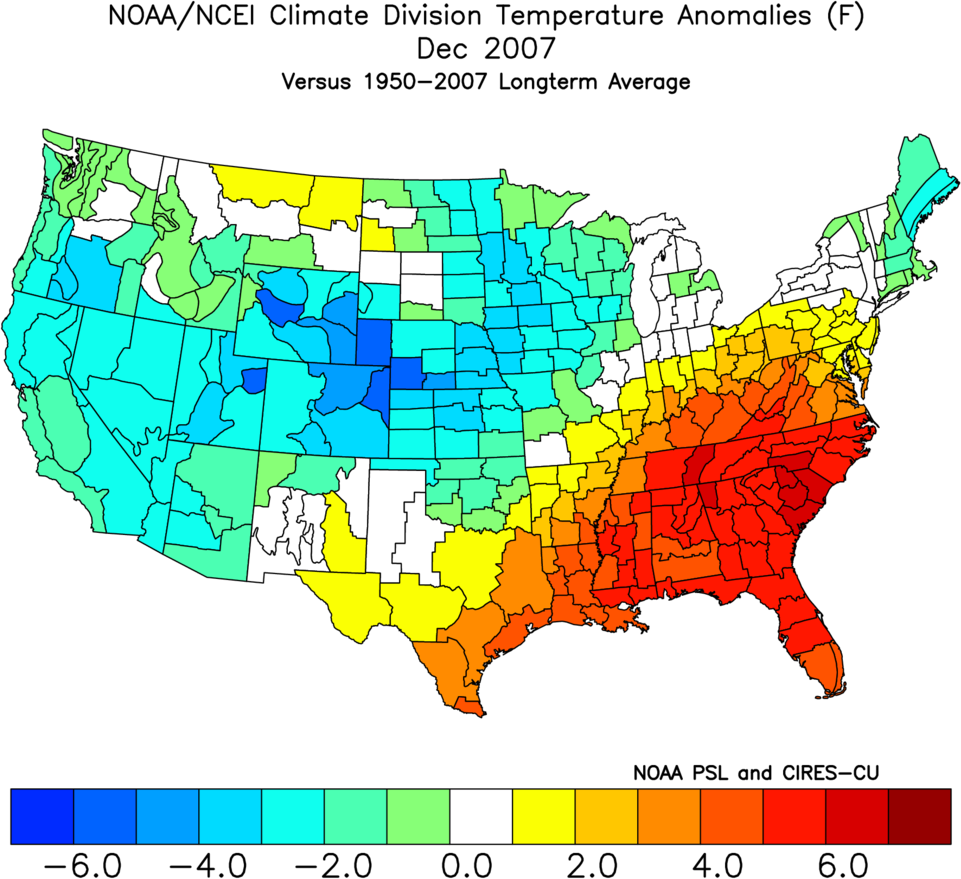
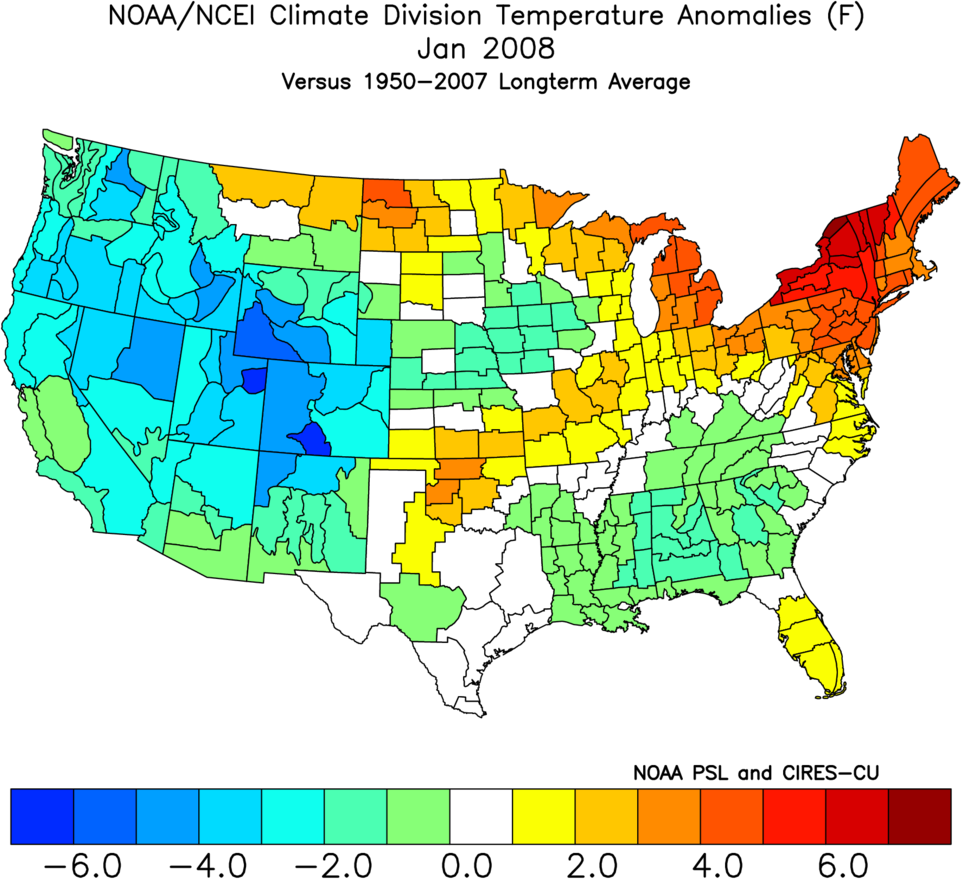
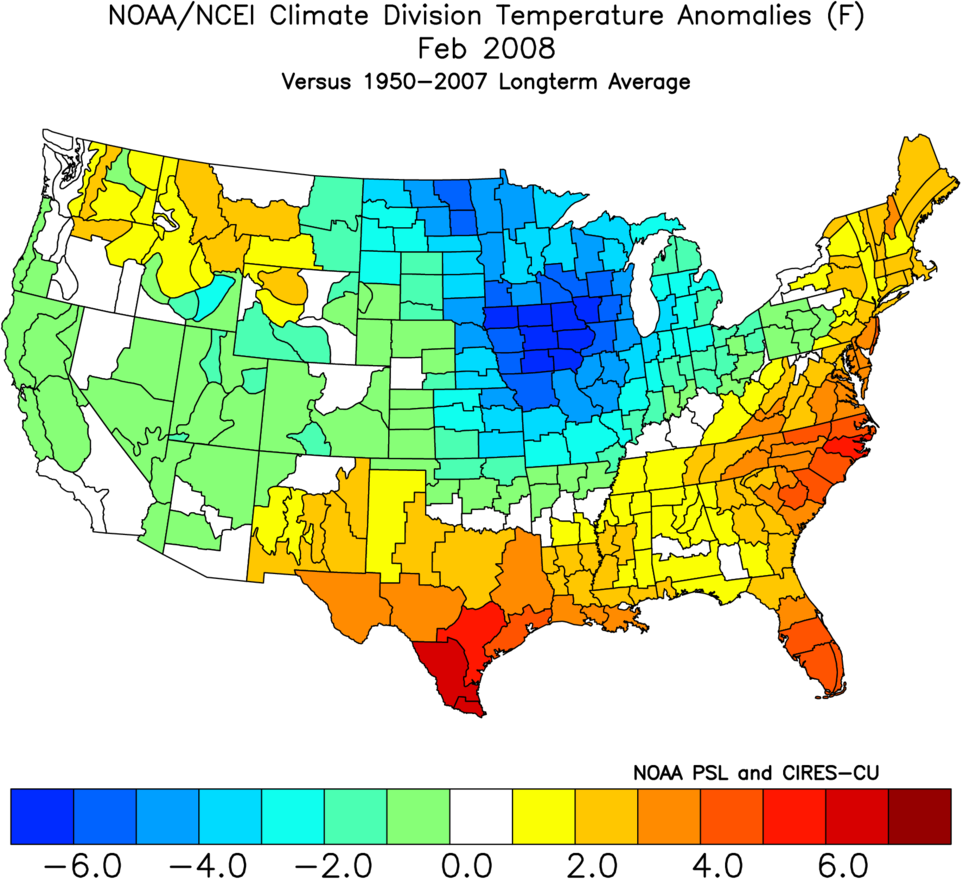
| Snowfall Totals | ||||||
|---|---|---|---|---|---|---|
| City | Station | December | January | February | March | Season Total |
| Boston | KBOS | 26.9 | 8.3 | 15.0 | 1.0 | 51.2 |
| New York City | KNYC | 2.9 | 0.0 | 9.0 | 0.0 | 11.9 |
| Philadelphia | KPHL | 1.6 | 1.0 | 3.7 | 0.0 | 6.3 |
| Baltimore | KBWI | 4.8 | 2.4 | 1.3 | 0.0 | 8.5 |
| Washington, D.C. | KDCA | 2.6 | 1.3 | 1.0 | 0.0 | 4.9 |
| Richmond | KRIC | 0.0 | 0.8 | 0.0 | 0.0 | 0.8 |
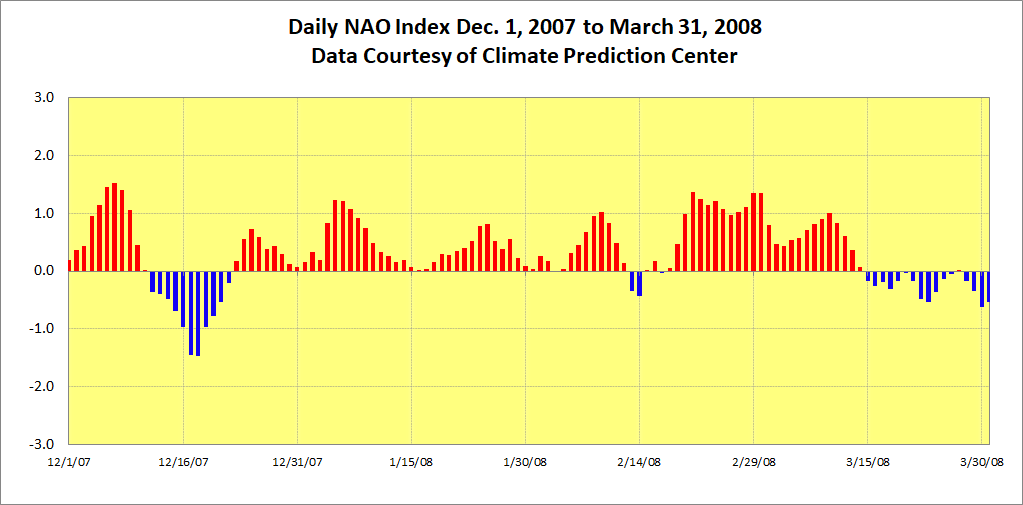
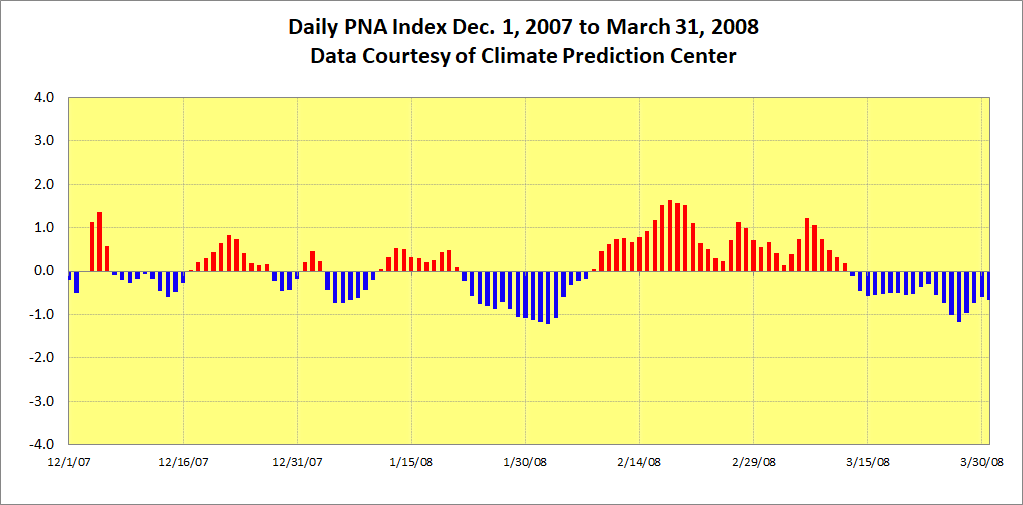
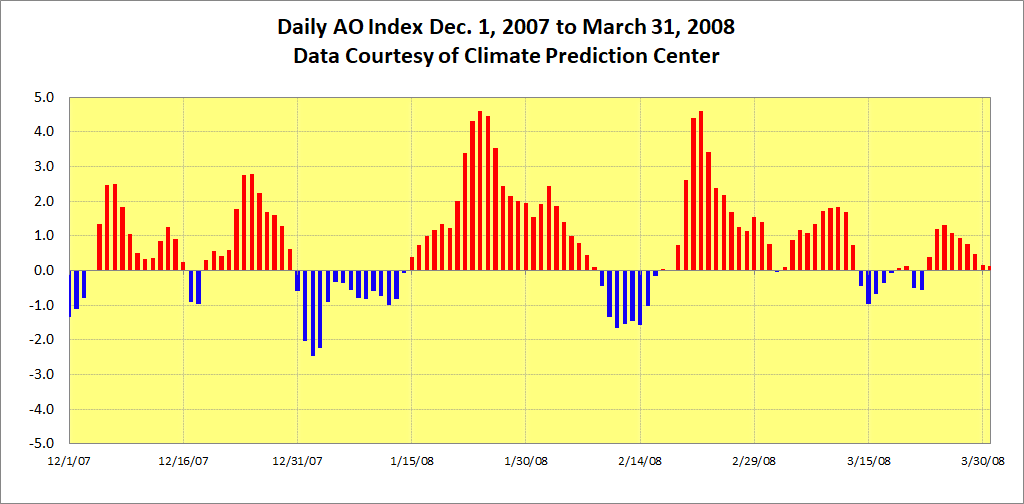
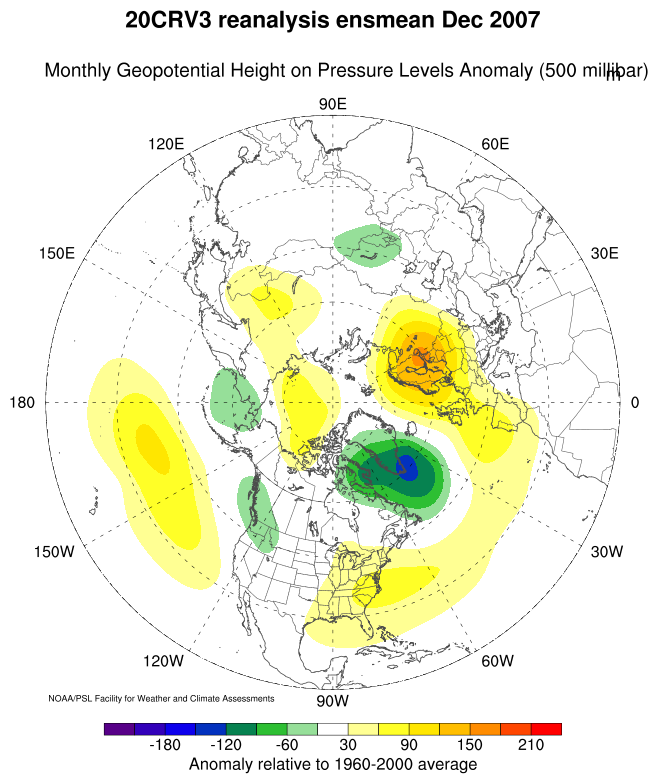
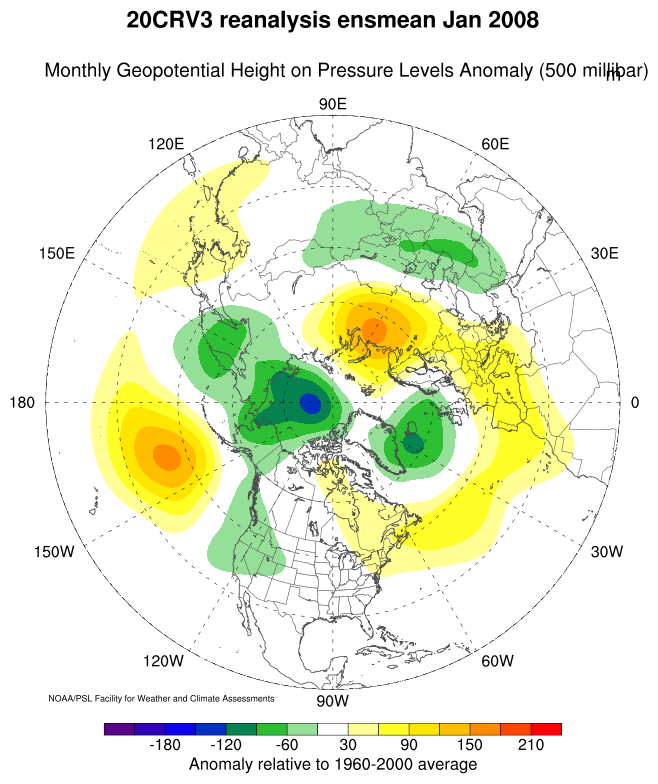
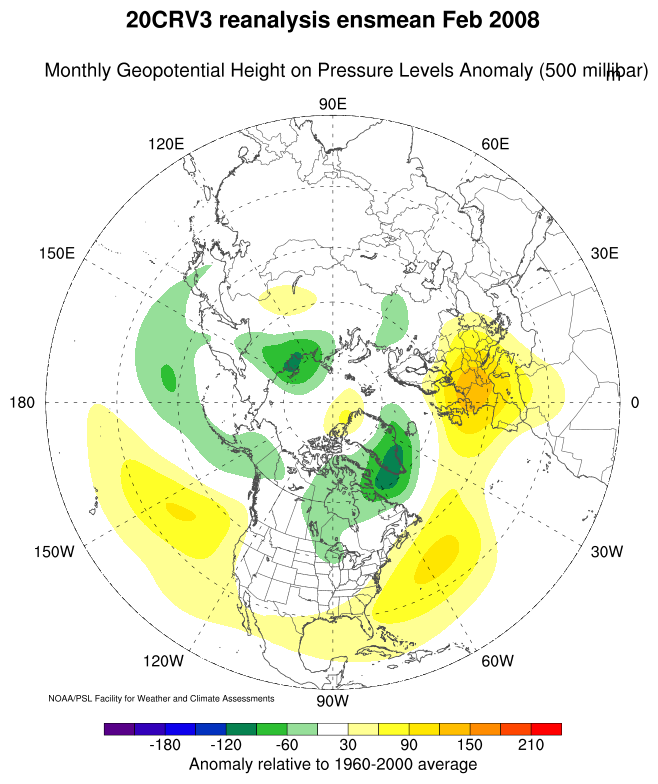
| NAO | PNA | AO |
|---|---|---|
|
|
|
| Monthly Index Values(HADISST) | ||||
|---|---|---|---|---|
| Month | Nino 1+2 | Nino 3 | Nino 3.4 | Nino 4 |
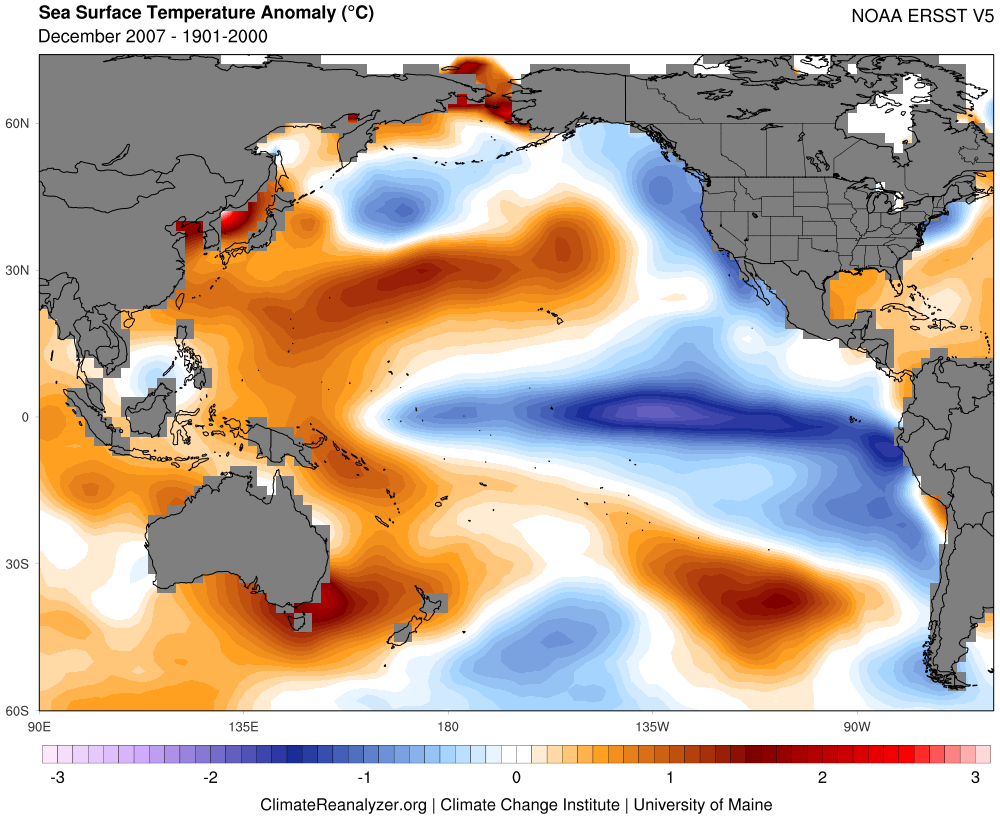
| December | -1.63 | -1.67 | -1.61 | -1.08 |
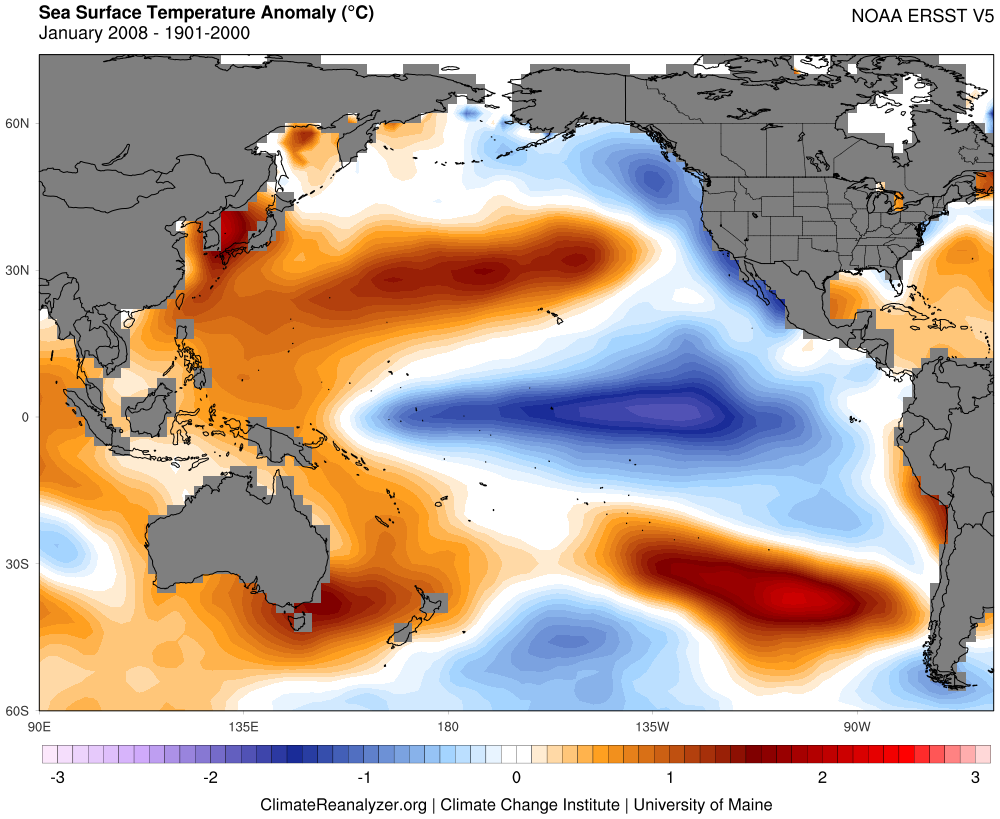
| January | -0.80 | -1.60 | -1.79 | -1.38 |
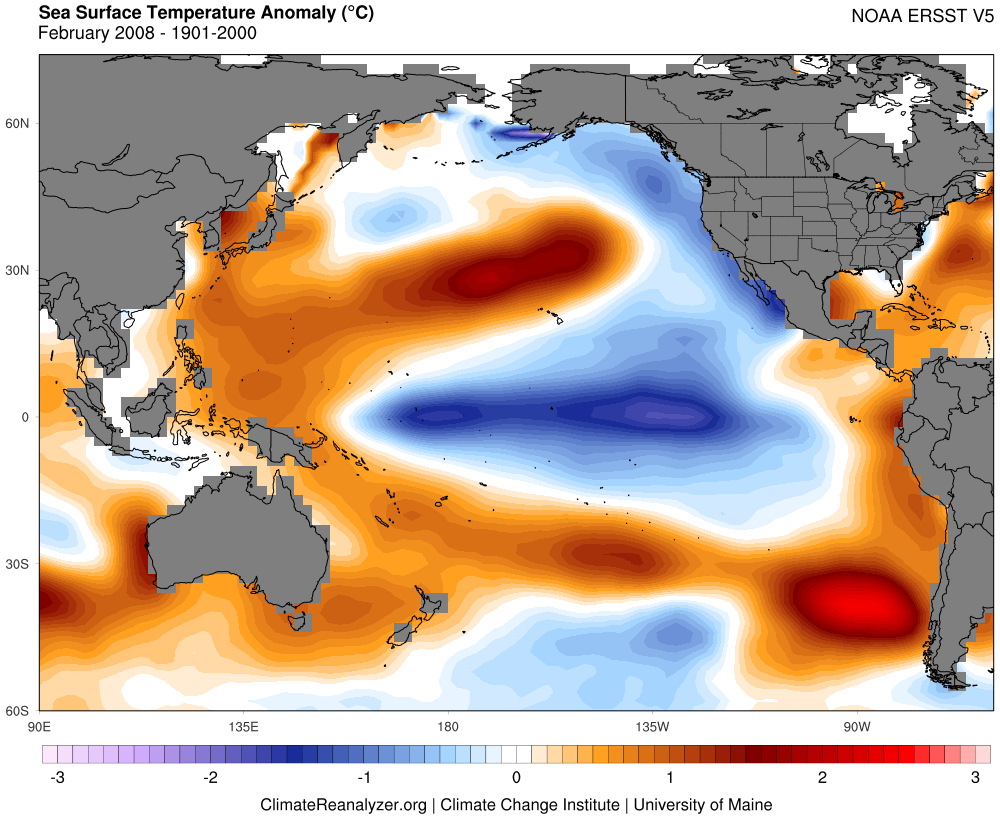
| February | -0.16 | -1.25 | -1.70 | -1.46 |
| March | 0.33 | -0.73 | -1.17 | -1.23 |
| HADISST values removed 1981-2010 base period | ||||
| Monthly Index Values(ERSST.v5) | ||||
|---|---|---|---|---|
| Month | Nino 1+2 | Nino 3 | Nino 3.4 | Nino 4 |
| December | -1.73 | -1.63 | -1.55 | -1.02 |
| January | -0.46 | -1.47 | -1.69 | -1.37 |
| February | 0.30 | -1.24 | -1.66 | -1.48 |
| March | 0.46 | -0.71 | -1.16 | -1.24 |
| **ERSST.v5 values using 1981-2010 base periods** | ||||
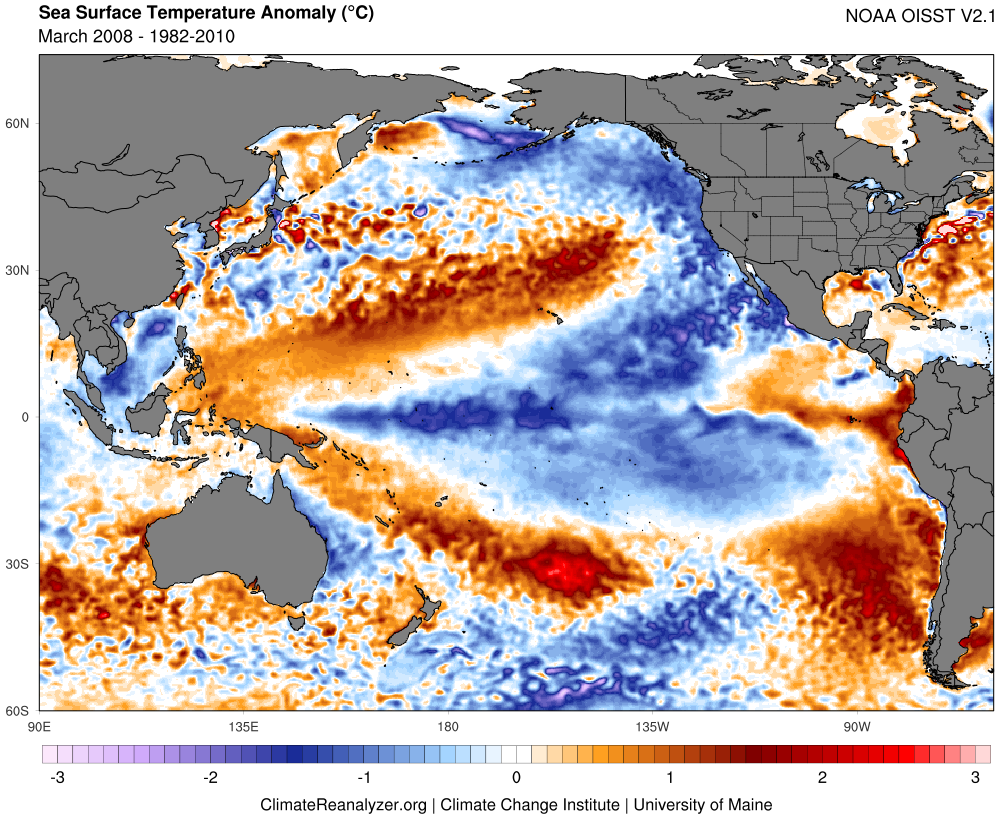
| Monthly Index Values(OISST.v2) | ||||
|---|---|---|---|---|
| Month | Nino 1+2 | Nino 3 | Nino 3.4 | Nino 4 |
| December | -1.77 | -1.55 | -1.60 | -1.19 |
| January | -0.60 | -1.50 | -1.86 | -1.68 |
| February | 0.25 | -1.32 | -1.89 | -1.67 |
| March | 0.78 | -0.58 | -1.15 | -1.35 |
| **OISST.v2 values using 1981-2010 base periods** | ||||
| Historic Nino 3.4/Oceanic-Nino Index Values(ERSST.v5) | |||
|---|---|---|---|
| Month | Nino 3.4 | 3-Month Period | ONI |
| December | -1.58 | Nov/Dec/Jan | -1.60 |
| January | -1.68 | Dec/Jan/Feb | -1.64 |
| February | -1.66 | Jan/Feb/Mar | -1.52 |
| March | -1.21 | ||
| **Anomalies calculated using 30-year climatological values, updated every five years. The updating of base periods removes observed warming trend in Nino 3.4 region. Anomalies generated from CPC** | |||
| Multivariate/Bivariate ENSO Indexes | |||||
|---|---|---|---|---|---|
| Month | MEI-V1 | MEI-V2 | Month | BEST | |
| Dec/Jan | -1.006 | -1.08 | December | -1.60 | |
| Jan/Feb | -1.371 | -1.27 | January | -1.75 | |
| Feb/Mar | -1.552 | -1.54 | February | -2.52 | |
| March | -1.24 | ||||
| Monthly SOI Index | |||
|---|---|---|---|
| December | January | February | March |
| 14.4 | 14.1 | 21.3 | 12.2 |
| Monthly Index Values | |||
|---|---|---|---|
| NOAA-NCEI | UW-JISAO | JMA-TCC | |
| December | -0.87 | -0.58 | -0.4671 |
| January | -1.50 | -1.00 | -0.9676 |
| February | -1.46 | -0.77 | -0.8538 |
| March | -1.26 | -0.71 | -0.6805 |
 |
 |
| ERSST.v5 | |||
|---|---|---|---|
 |
 |
 |
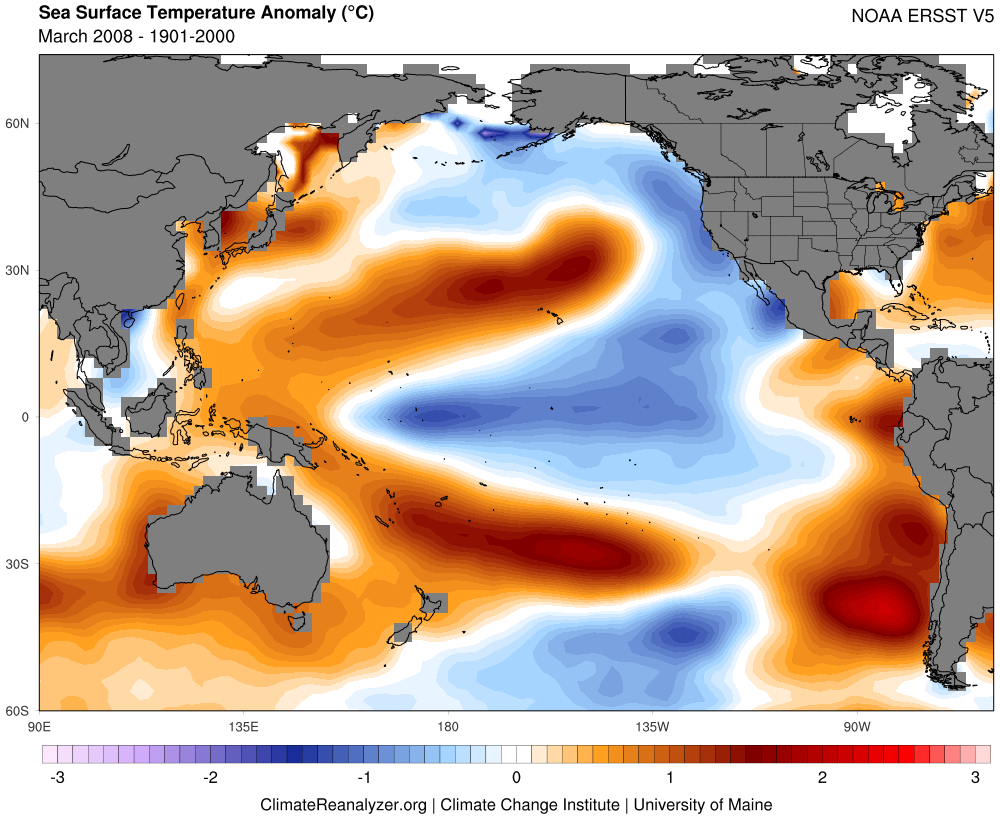 |
OISST.v2.1 |
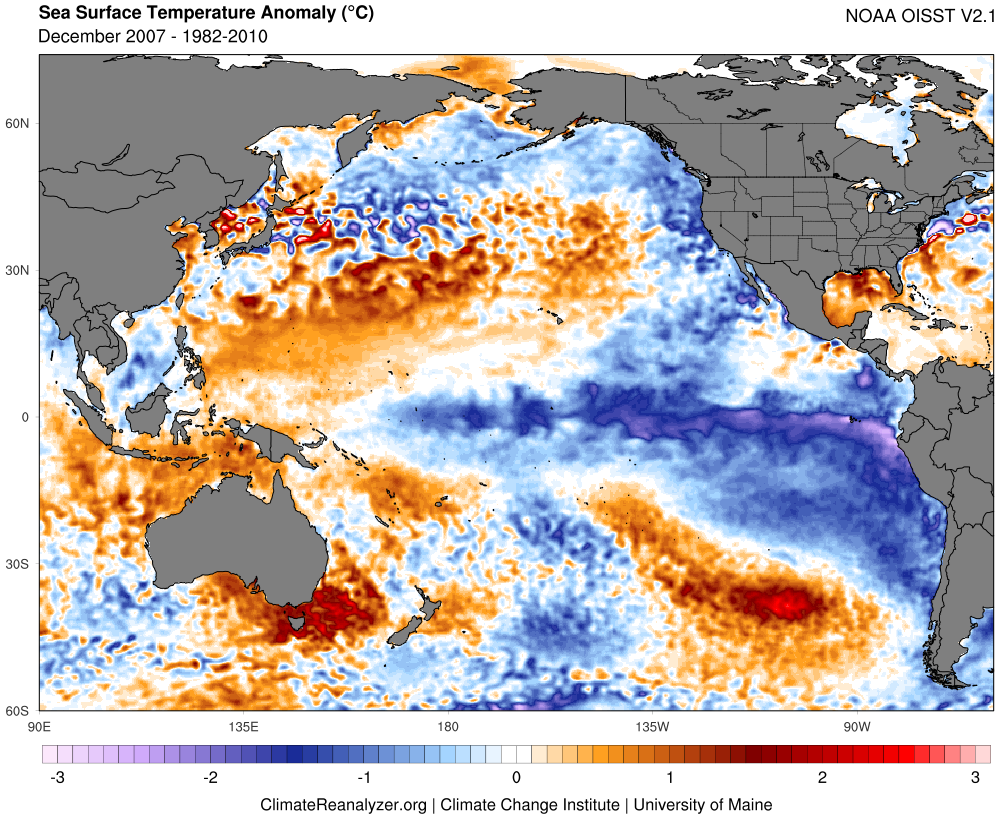 |
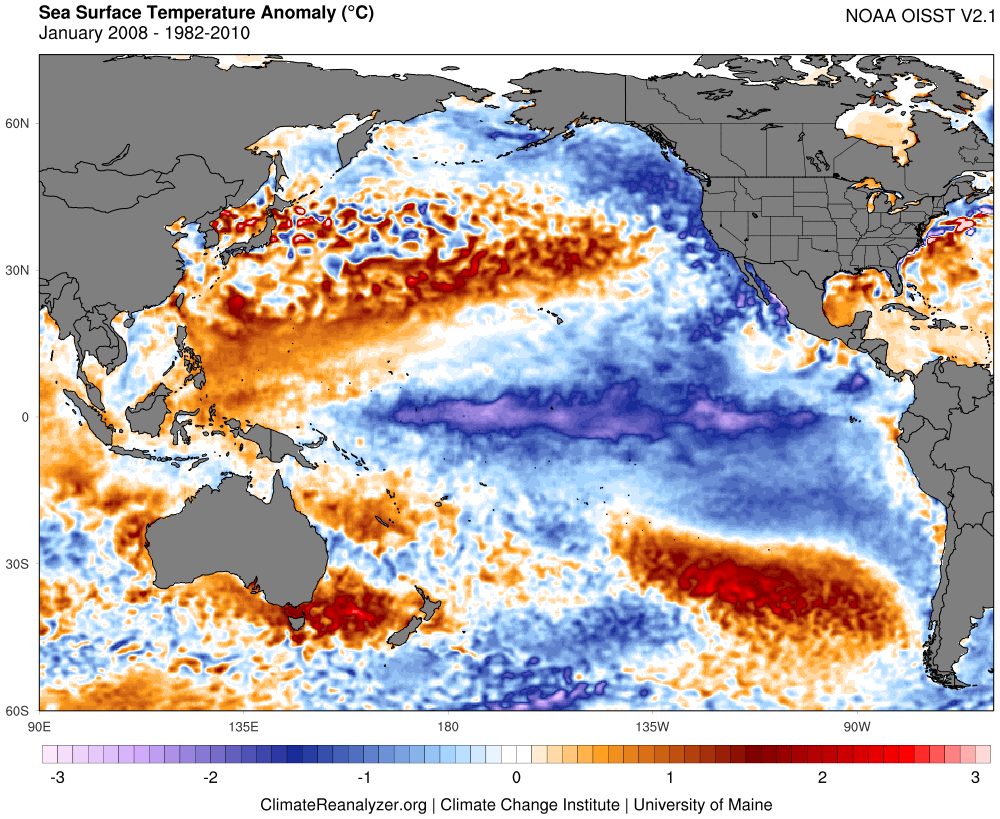 |
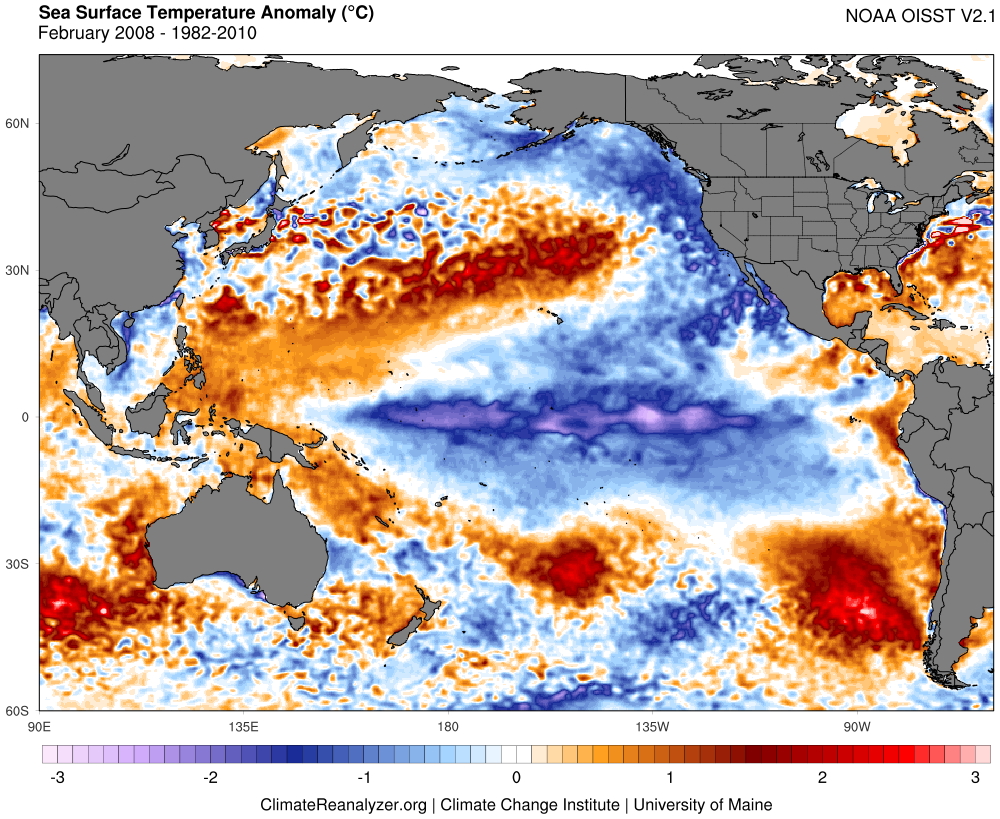 |
 |
| Monthly Temperature | |||
|---|---|---|---|
 |
 |
 |
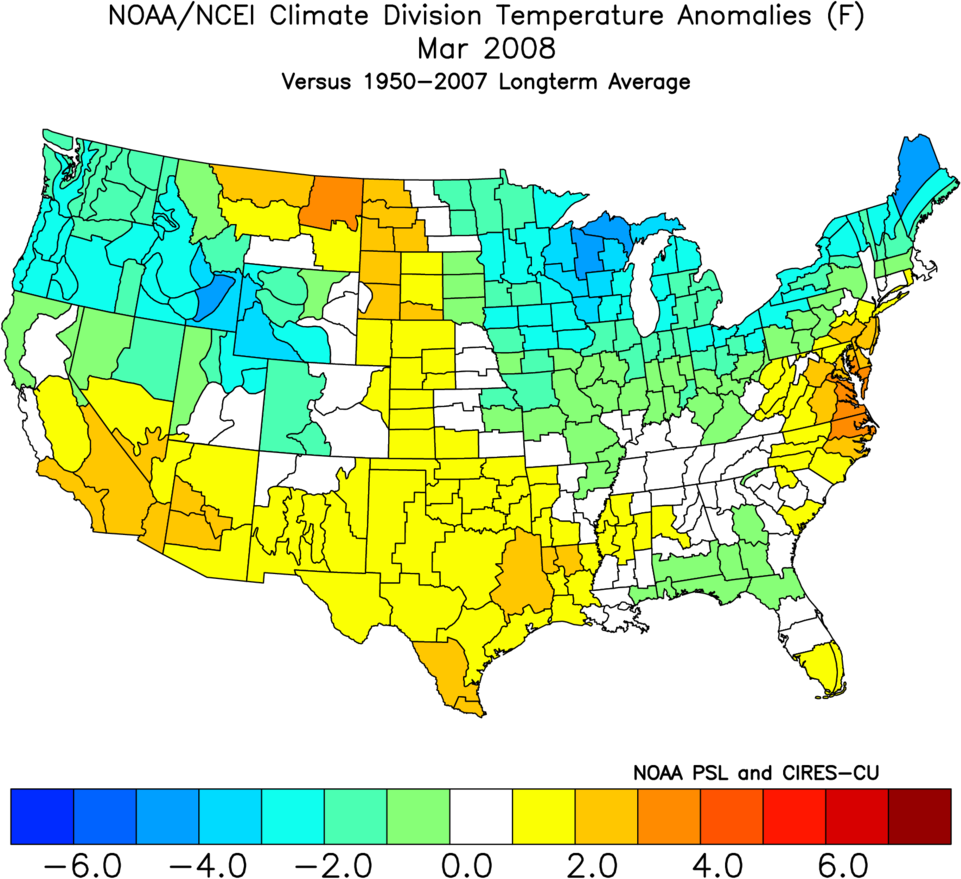 |
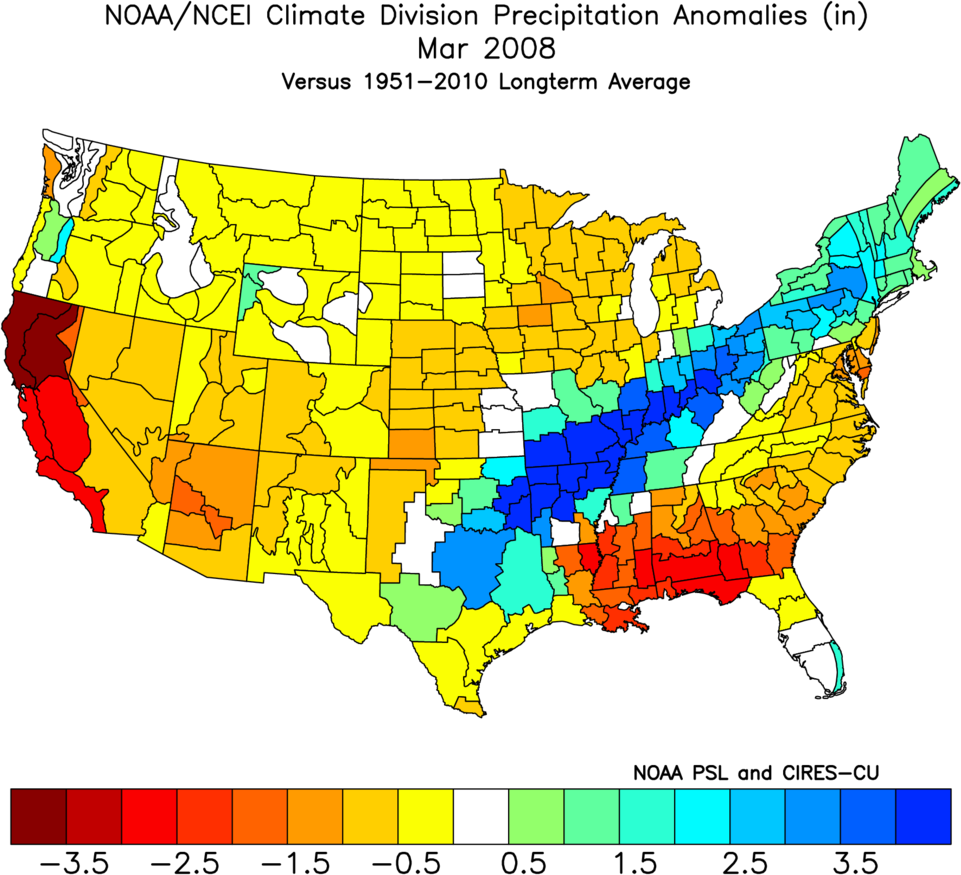
| Monthly Precipitation | |||
|---|---|---|---|
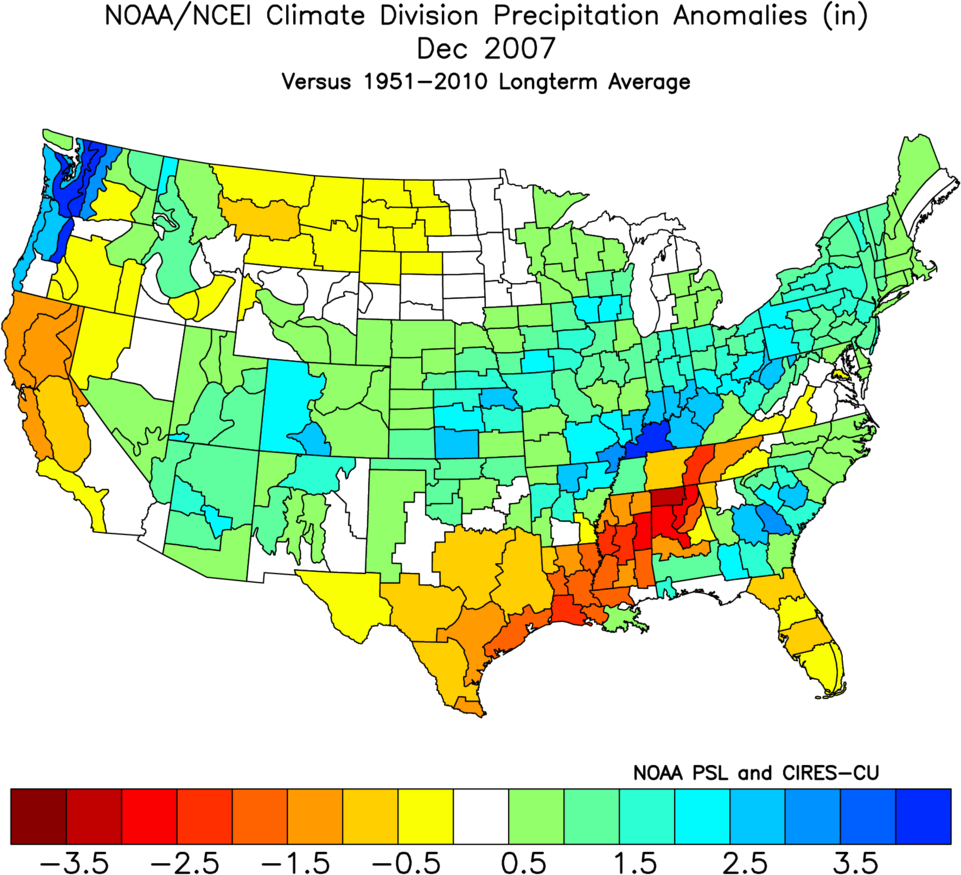 |
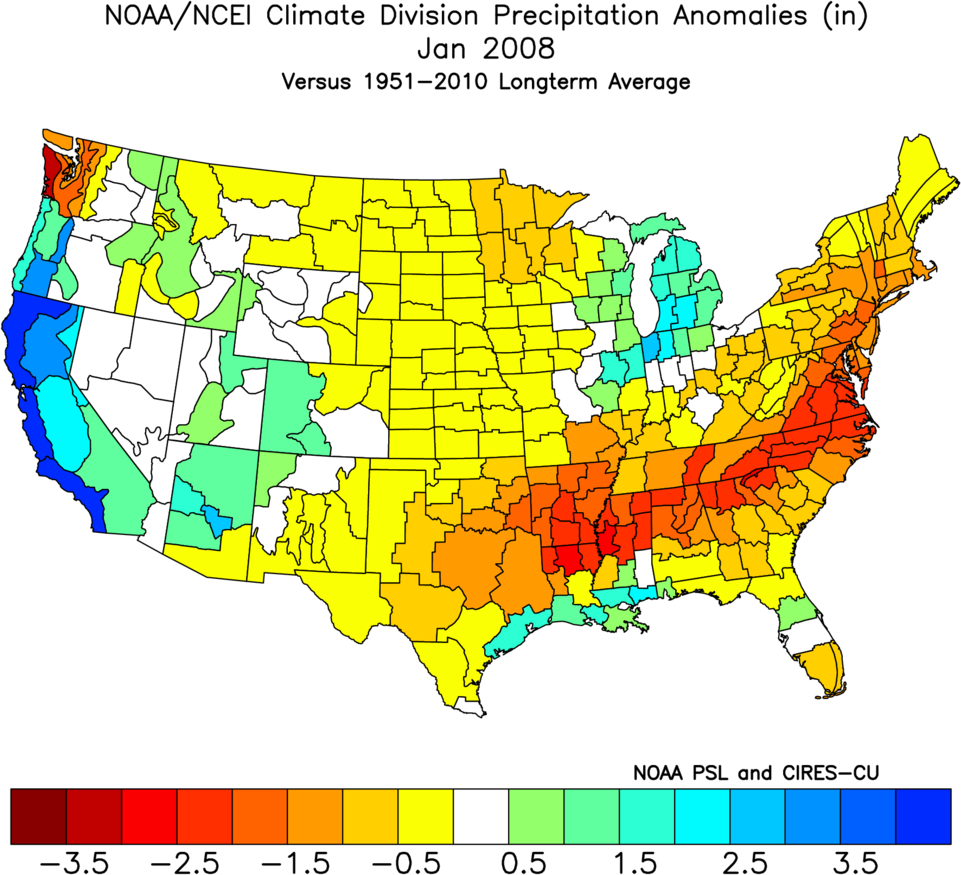 |
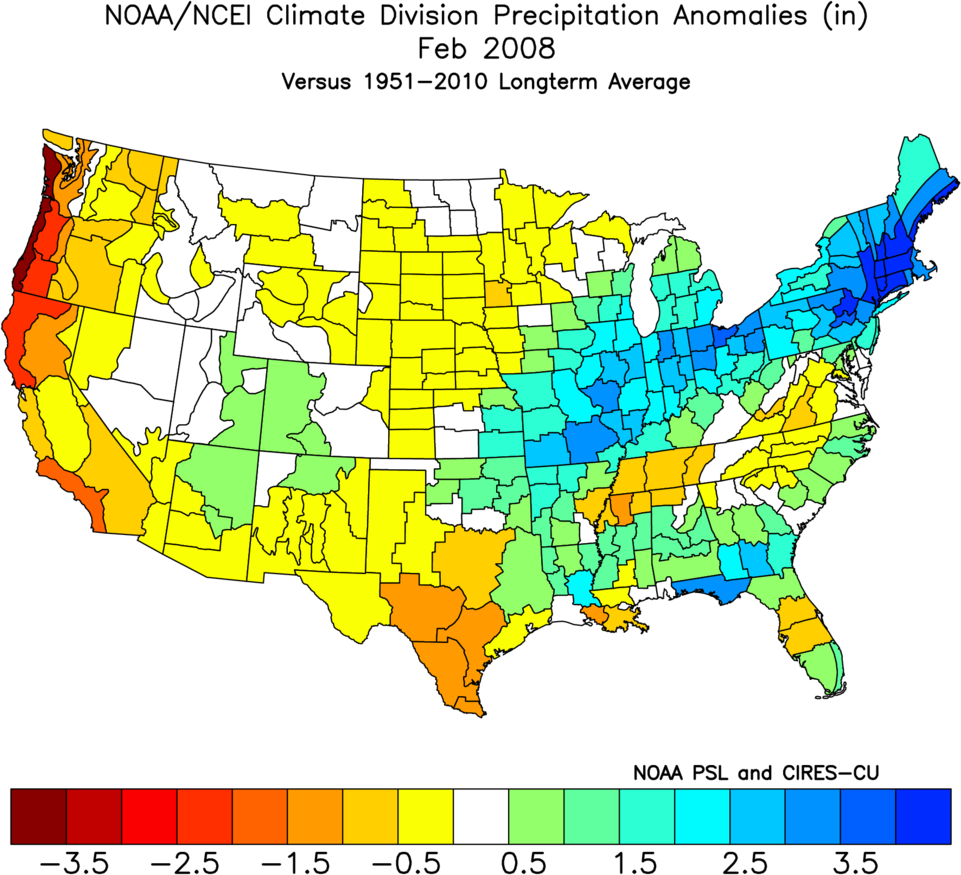 |
 |
 |
 |
 |
 |