
| Snowfall Totals | ||||||
|---|---|---|---|---|---|---|
| City | Station | December | January | February | March | Season Total |
| Boston | KBOS | 4.5 | 12.4 | 9.8 | 19.2 | 45.9 |
| New York City | KNYC | 13.4 | 8.3 | 9.5 | 3.8 | 35.0 |
| Philadelphia | KPHL | 10.5 | 3.8 | 10.0 | 1.8 | 26.1 |
| Baltimore | KBWI | 1.3 | 3.7 | 3.7 | 0.0 | 8.7 |
| Washington, D.C. | KDCA | 2.0 | 2.4 | 2.8 | 0.2 | 7.4 |
| Richmond | KRIC | Missing | 0.3 | 2.5 | 0.5 | 3.3 |
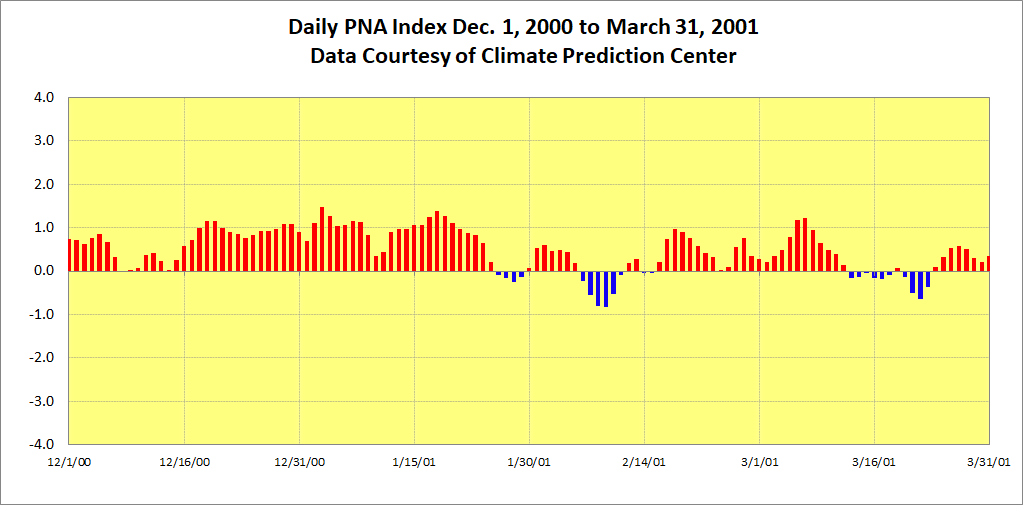
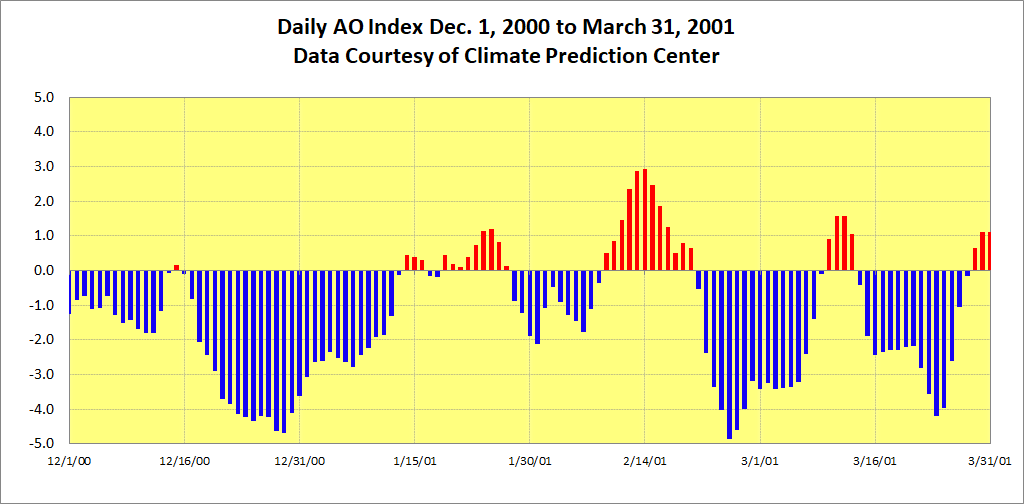
| NAO | PNA | AO |
|---|---|---|
|
|
|
| Monthly Index Values(HADISST) | ||||
|---|---|---|---|---|
| Month | Nino 1+2 | Nino 3 | Nino 3.4 | Nino 4 |
| December | -0.55 | -0.72 | -0.92 | -0.80 |
| January | -0.76 | -0.71 | -0.88 | -0.82 |
| February | -0.33 | -0.40 | -0.63 | -0.77 |
| March | 0.35 | -0.10 | -0.48 | -0.61 |
| HADISST values removed 1981-2010 base period | ||||
| Monthly Index Values(ERSST.v5) | ||||
|---|---|---|---|---|
| Month | Nino 1+2 | Nino 3 | Nino 3.4 | Nino 4 |
| December | -1.03 | -0.63 | -0.88 | -0.85 |
| January | -0.61 | -0.43 | -0.74 | -0.81 |
| February | -0.40 | -0.29 | -0.62 | -0.73 |
| March | 0.24 | 0.04 | -0.43 | -0.59 |
| **ERSST.v5 values using 1981-2010 base periods** | ||||
| Monthly Index Values(OISST.v2) | ||||
|---|---|---|---|---|
| Month | Nino 1+2 | Nino 3 | Nino 3.4 | Nino 4 |
| December | -0.57 | -0.71 | -0.98 | -0.89 |
| January | -0.58 | -0.64 | -0.83 | -0.80 |
| February | -0.16 | -0.31 | -0.61 | -0.83 |
| March | 0.92 | 0.09 | -0.38 | -0.57 |
| **OISST.v2 values using 1981-2010 base periods** | ||||
| Historic Nino 3.4/Oceanic-Nino Index Values(ERSST.v5) | |||
|---|---|---|---|
| Month | Nino 3.4 | 3-Month Period | ONI |
| December | -0.88 | Nov/Dec/Jan | -0.74 |
| January | -0.63 | Dec/Jan/Feb | -0.68 |
| February | -0.53 | Jan/Feb/Mar | -0.52 |
| March | -0.39 | ||
| **Anomalies calculated using 30-year climatological values, updated every five years. The updating of base periods removes observed warming trend in Nino 3.4 region. Anomalies generated from CPC** | |||
| Multivariate/Bivariate ENSO Indexes | |||||
|---|---|---|---|---|---|
| Month | MEI | Month | BEST | ||
| Dec/Jan | -0.496 | December | -0.78 | ||
| Jan/Feb | -0.649 | January | -0.87 | ||
| Feb/Mar | -0.548 | February | -1.15 | ||
| March | -0.46 | ||||
| Monthly SOI Index | |||
|---|---|---|---|
| December | January | February | March |
| 7.7 | 8.4 | 11.9 | 6.7 |
| Monthly Index Values | |||
|---|---|---|---|
| NOAA-NCEI | UW-JISAO | JMA-TCC | |
| December | 0.00 | 0.52 | 0.2154 |
| January | 0.48 | 0.60 | 0.6658 |
| February | -0.01 | 0.29 | 0.3210 |
| March | -0.41 | 0.45 | 0.0923 |
 |
 |
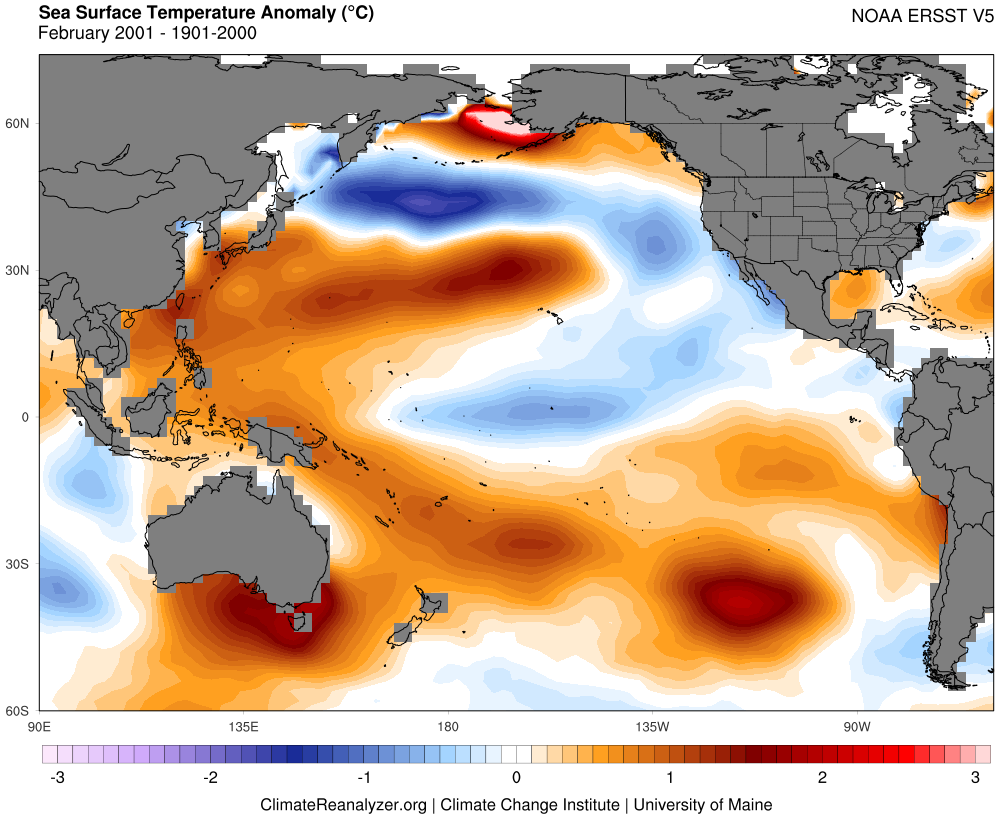
| ERSST.v5 | |||
|---|---|---|---|
 |
 |
 |
 |
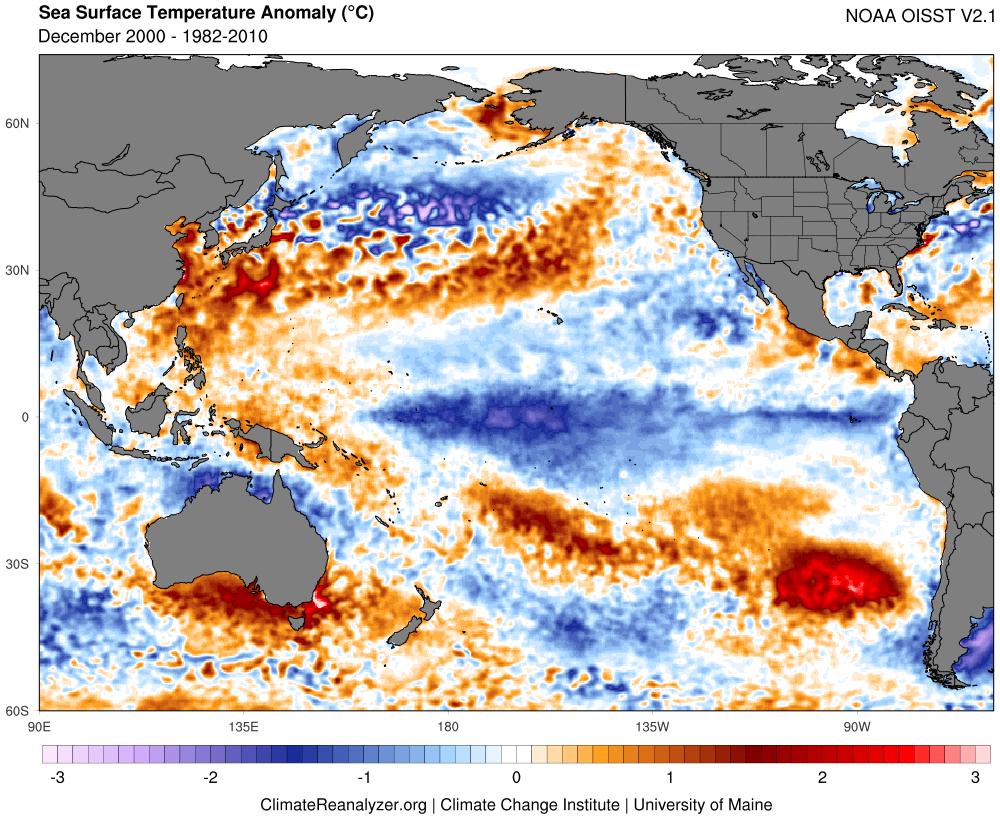
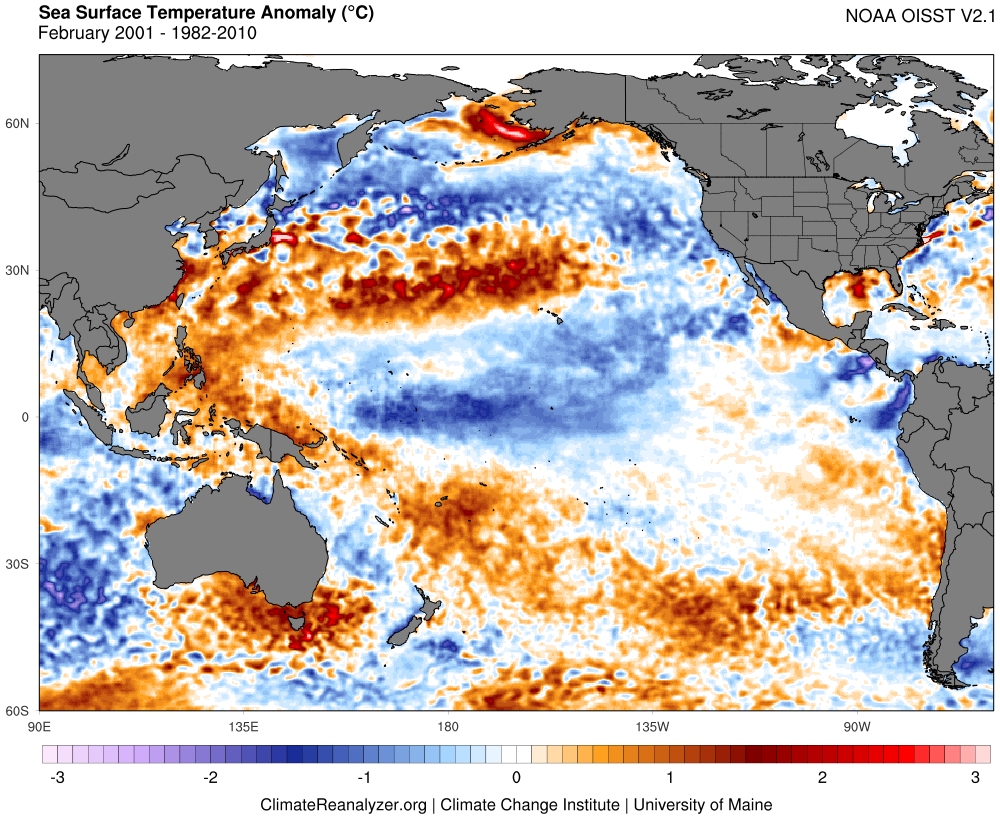
OISST.v2.1 |
 |
 |
 |
 |
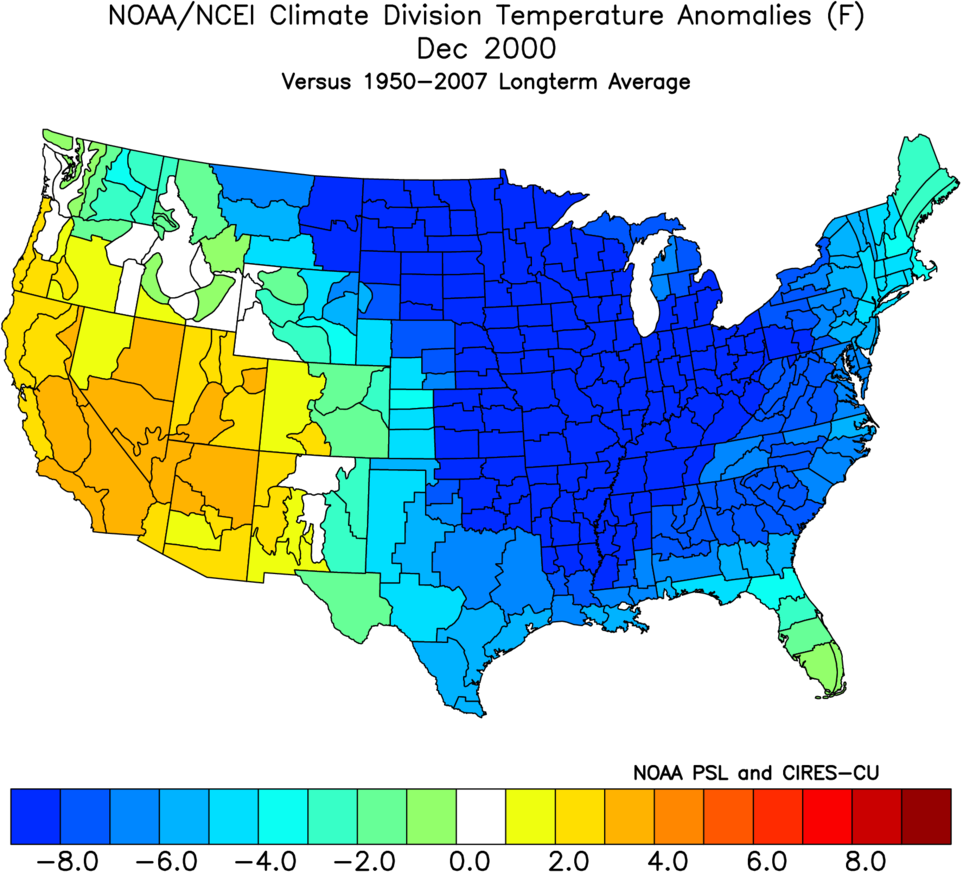
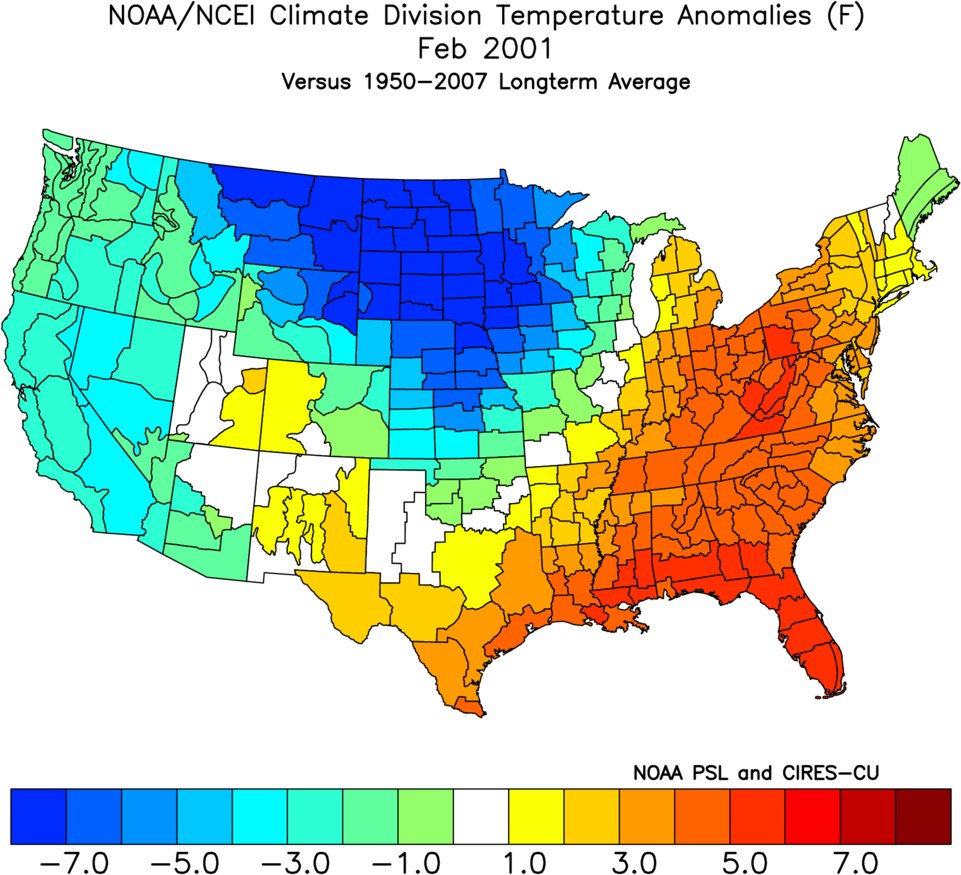
| Monthly Temperature | |||
|---|---|---|---|
 |
 |
 |
 |
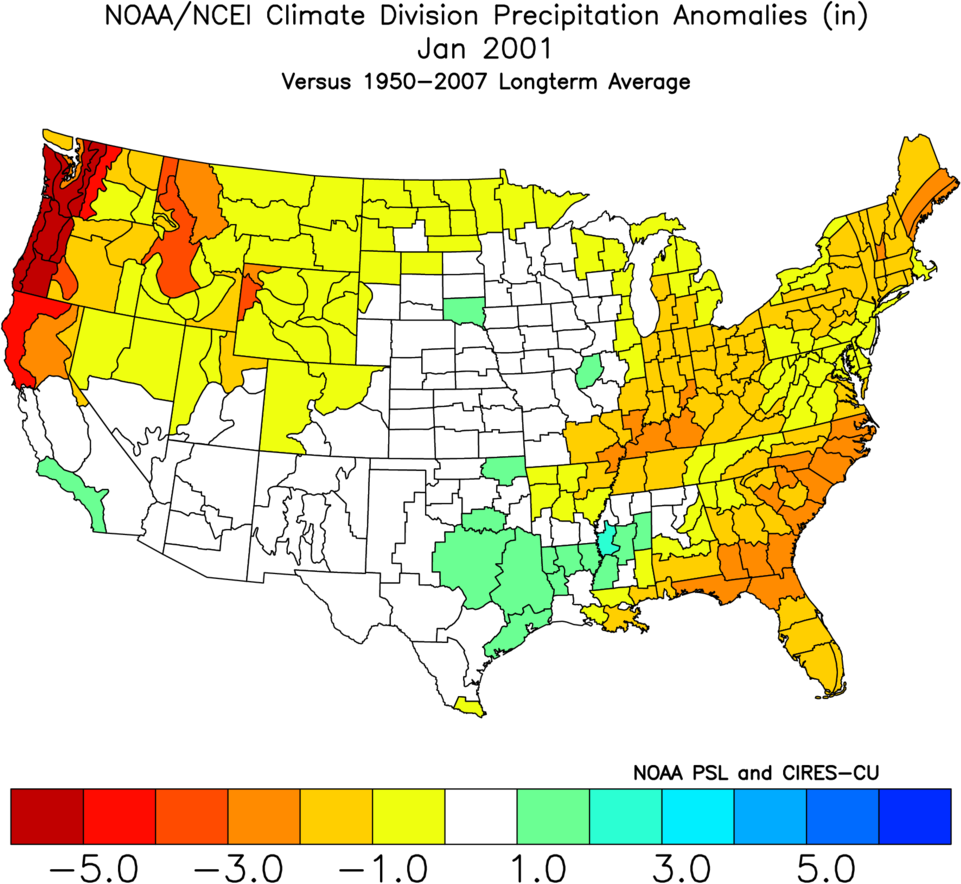
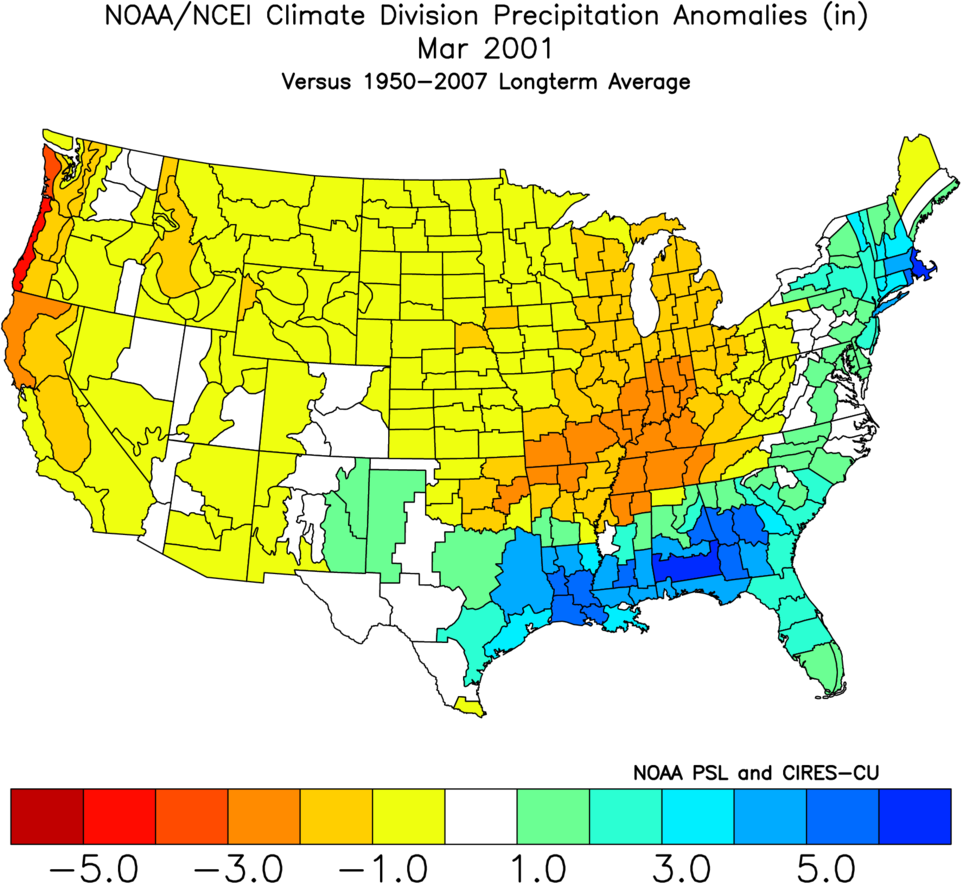
| Monthly Precipitation | |||
|---|---|---|---|
 |
 |
 |
 |
 |
 |
 |
 |