The Influence of Climate Variability
on Monthly and Seasonal Snowfall

22

2015 Mark Sannutti

Introduction and Purpose

There have been many studies done over the past several decades to compare snowfall and their relationahip to the various patterns of climate variability across the globe. These teleconnection patterns as they are known, relate to pressure and circulation(land and ocean) anomalies covering large geographical areas. They can be very beneficial to predicting snowfall on a short-term, long-term and seasonal basis. The purpose of this study is to show how the various climate patterns independently influence monthly and seasonal snowfall for select cites across a few regions of the United States. It will also be determined if one climate(teleconnection) pattern has a strong statistical advantage over another.

Motivation for this research comes from similar work that was done in 2003 during my senior year in college. See the link

2015 Mark Sannutti

Methodology

Links to the methodology of the teleconnection patterns used in this study are listed below. In addition, a link is provided for the sources of the index values.

  1. North Atlantic Oscillation(NAO)
  2. Pacific-North American Pattern(PNA)
  3. Arctic Oscillation(AO)
  4. Pacific Decadal Oscillation(PDO)
  5. Atlantic Decadal Oscillation(AMO)
  6. El Nino-Southern Oscillation(ENSO)
  7. Eastern Pacific Oscillation(EPO)
  8. Tropical-Northern Hemisphere Pattern(TNH)

2015 Mark Sannutti

Data and Methods

In this study, the data analyzed are monthly and seasonal values for snowfall and the index values of global climate(teleconnection) patterns. The time period covers the months of December, January and Febuary from 1950-2010. The climate patterns used are the NAO, PNA, AO, PDO, AMO, ENSO, EPO and TNH. Several cities in different geographical regions of the United States were selected. The cities cover the Midwest, Ohio Vally, Middle-Atlantic and Northeast regions. The city, station ID and data source are shown in the following table.


City Station ID Data Source
Philadelphia, PA KPHL National Climatic Data Center
Washington, D.C. KDCA National Climatic Data Center
New York City, NY KNYC NWS - Upton, NY Office
Boston, MA KBOS NWS - Boston, NY Office
St. Louis, MO KSTL NWS - St. Louis, MO Office
Chicago, IL KMDW Illinois State Climatologist
Minneapolis, MN KMSP Minnesota Climatology Working Group
Indianapolis, IN KIND National Climatic Data Center

Two sets of variables were constructed using contingency tables. One set was the index values of the climate patterns. The other was total snowfall for individual months. The index values were assigned a low, medium, and high value. These values can also be considered the phase strenth and signal of each pattern, meaning a negative, neutral or positive phase. The range was delineated by the total number of trials, sorted from lowest to highest and dividing it by three. For snowfall, the same strategy as with the index values was performed. Snowfall was also assigned a low, medium and high value. With snowfall, if a particular station had multiple months or seasons with 'zero' as a total, the total number would still be divided by three. However, only one 'zero' value would be included and all others would just be added to the total for the 'low' range. Lastly, the reason to divide the total number of trials by three was to remove any biases in the data.

The two data sets were first done for monthly values and then again for seasonal values. For seasonal values, the only difference was that the totals for snowfall and index value were computed by adding the total of the three months and divided by three for a seasonal average.


Statistical analysis was performed at the end using the Chi-Square Test for independence to see the significance of the results. The equation is as follows:


n= total number of months or seasons
Oi= observed value
Ei= expected Value
X2= Chi-Square value

2015 Mark Sannutti

Sample

Here is a sample of the data when performing the analysis. The city shown is Philadelphia, PA. I only included four of the eight patterns used in the study(PNA, AO, PDO and SOI). I have posted two things. First is the contigency tables with the results. The thresholds for low, medium and high values of the climate imdex values are shown as well. Also included are the chi-square values and p-values for statistical significance. Below that is a table with the monthly index values and their assocated snowfall total during that month. The table is sorted by negative to positve values for the climate indexes.

The same procedure was performed for seasonal values(not listed).

Pacific-North American Index

PNA Low: -2.07 to -0.31 Medium: -0.30 to 0.61 High: 0.63 to 2.42
      Index Value
      LOW MEDIUM HIGH TOTAL
Total Snowfall 7.3 - 51.5 13(17.7) 23(17.7) 17(17.7) 53
(inches) 2.4 - 7.0 21(17.7) 16(17.7) 16(17.7) 53
0 - 2.2 26(24.7) 21(24.7) 27(24.7) 74
    Total 60 60 60 180
             
X2=4.65   P-Value= 0.325 Insignificant


Arctic Oscillation

Thresholds Low: -4.266 to -1.046 Medium: -1.036 to 0.186 High: 0.194 to 3.495
      Index Value
      LOW MEDIUM HIGH TOTAL
Total Snowfall 7.3 - 51.5 26(17.7) 18(17.7) 9(17.7) 53
(inches) 2.4 - 7.0 17(17.7) 16(17.7) 20(17.7) 53
0 - 2.2 17(24.7) 26(24.7) 31(24.7) 74
    Total 60 60 60 180
             
X2=12.8   P-Value= 0.012 Very Statistically Significant


Pacific Decadal Oscillation

Thresholds Low: -2.75 to -0.65 Medium: -0.64 to 0.31 High: 0.33 to 2.10
      Index Value
      LOW MEDIUM HIGH TOTAL
Total Snowfall 7.3 - 51.5 13(17.7) 12(17.7) 28(17.7) 53
(inches) 2.4 - 7.0 23(17.7) 17(17.7) 13(17.7) 53
0 - 2.2 24(24.7) 31(24.7) 19(24.7) 74
    Total 60 60 60 180
             
X2=14.9   P-Value= 0.005 Very Statistically Significant


Southern Oscillation Index

Thresholds Low: -33.3 to -4.0 Medium: -3.6 to 5.3 High: 5.6 to 23.0
      Index Value
      LOW MEDIUM HIGH TOTAL
Total Snowfall 7.3 - 51.5 24(18.6) 17(17.1) 12(17.4) 53
(inches) 2.4 - 7.0 11(18.6) 20(17.1) 22(17.4) 53
0 - 2.2 28(25.9) 21(23.8) 25(24.3) 74
    Total 63 58 59 180
             
X2=8.60   P-Value= 0.072 Mildly Significant


PNA AO PDO SOI
-2.07 1.1 -4.266 51.5 -2.75 1.1 -33.3 26.1
-1.98 4.0 -3.767 15.7 -2.74 1.1 -30.6 0.2
-1.86 0.9 -3.413 24.1 -2.69 5.2 -29.1 12.9
-1.82 27.6 -3.311 6.1 -2.48 7.0 -25.4 1.2
-1.80 1.9 -3.232 16.0 -2.23 6.4 -24.4 19.0
-1.74 6.8 -3.114 9.5 -2.02 6.5 -23.5 0.5
-1.73 2.6 -3.014 19.0 -2.01 4.0 -21.3 6.8
-1.60 0.2 -2.967 1.9 -2.00 13.7 -19.2 0.0
-1.56 3.1 -2.904 11.5 -1.99 3.2 -17.3 0.9
-1.48 8.2 -2.806 11.9 -1.90 7.7 -16.8 3.7
-1.46 0.1 -2.587 3.1 -1.87 0.1 -16.7 0.0
-1.44 3.1 -2.484 0.8 -1.85 3.1 -14.5 51.5
-1.41 0.4 -2.412 7.5 -1.83 8.2 -14.0 0.0
-1.41 3.2 -2.354 10.5 -1.82 4.7 -13.6 0.4
-1.39 7.7 -2.233 10.1 -1.79 0.0 -13.5 1.9
-1.36 0.2 -2.228 16.9 -1.74 0.8 -13.5 0.0
-1.32 6.4 -2.212 3.1 -1.68 5.7 -12.6 2.0
-1.32 7.0 -2.154 1.7 -1.65 12.1 -12.6 10.1
-1.31 11.4 -2.127 7.3 -1.63 0.0 -12.1 0.0
-1.29 5.7 -2.104 7.0 -1.61 1.1 -12.0 16.0
-1.26 0.0 -2.084 2.2 -1.61 0.2 -11.6 8.0
-1.25 9.5 -2.081 0.5 -1.55 8.4 -11.6 0.0
-1.24 5.2 -2.074 2.8 -1.54 2.4 -11.6 7.6
-1.23 0.0 -2.066 6.1 -1.52 2.6 -10.7 2.7
-1.23 0.0 -2.029 1.1 -1.52 6.8 -10.7 11.5
-1.19 4.7 -2.013 3.3 -1.40 4.1 -10.6 0.2
-1.19 1.8 -2.010 0.2 -1.33 27.6 -10.6 8.4
-1.14 13.3 -1.948 1.5 -1.32 13.3 -10.1 7.5
-1.06 2.4 -1.928 0.2 -1.29 1.1 -10.1 3.1
-1.04 1.1 -1.856 7.5 -1.28 0.2 -9.3 1.0
-0.95 8.4 -1.827 2.0 -1.27 3.1 -9.2 4.0
-0.90 12.1 -1.806 26.1 -1.26 1.9 -9.1 0.2
-0.88 1.5 -1.747 0.0 -1.24 11.9 -9.1 0.0
-0.86 14.0 -1.721 0.0 -1.22 4.1 -8.7 3.3
-0.82 5.6 -1.721 4.7 -1.19 1.0 -8.2 1.0
-0.82 13.7 -1.687 0.3 -1.16 2.2 -8.0 0.4
-0.79 1.1 -1.686 7.6 -1.15 12.5 -7.9 0.0
-0.73 13.2 -1.668 5.2 -1.14 6.4 -7.9 10.9
-0.72 0.0 -1.592 8.4 -1.08 8.0 -7.5 4.9
-0.72 6.0 -1.542 6.8 -1.06 0.2 -7.4 29.6
-0.70 0.0 -1.528 0.4 -1.02 2.4 -7.3 2.2
-0.69 3.3 -1.513 1.8 -1.00 1.0 -7.0 24.1
-0.69 4.1 -1.506 19.7 -0.97 1.1 -6.9 16.9
-0.69 10.1 -1.473 10.1 -0.96 9.5 -6.9 9.5
-0.68 3.5 -1.440 4.4 -0.95 1.5 -6.5 0.3
-0.65 1.0 -1.438 3.7 -0.95 6.0 -6.3 15.2
-0.56 0.0 -1.438 11.4 -0.95 9.5 -6.0 2.0
-0.55 2.2 -1.401 18.8 -0.93 0.0 -5.5 5.6
-0.52 0.0 -1.325 2.7 -0.87 0.4 -5.5 0.0
-0.52 4.4 -1.322 0.0 -0.84 3.9 -5.5 7.3
-0.50 0.2 -1.307 6.5 -0.83 5.7 -5.4 2.7
-0.43 7.8 -1.271 12.9 -0.82 16.0 -5.0 5.3
-0.43 3.9 -1.216 2.8 -0.77 3.7 -5.0 1.5
-0.41 2.4 -1.204 7.0 -0.76 0.2 -4.9 3.9
-0.40 0.6 -1.200 33.8 -0.76 4.6 -4.5 1.5
-0.38 4.9 -1.178 8.0 -0.71 6.6 -4.1 11.4
-0.34 1.4 -1.163 2.7 -0.69 0.2 -4.0 0.0
-0.32 1.0 -1.148 15.2 -0.68 1.8 -4.0 18.8
-0.31 0.2 -1.066 1.5 -0.66 0.7 -4.0 7.4
-0.31 0.0 -1.046 11.9 -0.65 0.9 -4.0 11.9
-0.30 12.9 -1.036 5.1 -0.64 0.0 -4.0 15.7
-0.28 6.1 -0.980 0.0 -0.61 0.0 -4.0 10.1
-0.27 1.4 -0.959 3.8 -0.58 1.6 -4.0 0.0
-0.21 11.9 -0.934 0.4 -0.58 10.1 -3.6 0.2
-0.18 0.0 -0.922 0.8 -0.57 5.1 -3.5 7.8
-0.18 12.5 -0.883 14.0 -0.55 7.8 -3.5 11.9
-0.16 6.6 -0.876 1.0 -0.50 0.0 -3.2 0.0
-0.16 10.0 -0.862 13.2 -0.49 0.0 -3.0 5.7
-0.14 0.2 -0.783 3.1 -0.46 0.0 -3.0 2.6
-0.12 2.8 -0.711 9.5 -0.46 0.0 -3.0 2.8
-0.12 4.1 -0.697 27.6 -0.44 2.0 -3.0 0.0
-0.12 0.7 -0.672 8.4 -0.43 0.0 -3.0 0.0
-0.11 12.0 -0.644 5.3 -0.43 0.4 -3.0 23.4
-0.09 2.0 -0.622 10.0 -0.43 0.0 -2.7 9.8
-0.09 6.5 -0.576 0.6 -0.42 4.9 -2.7 6.5
-0.08 9.5 -0.575 12.4 -0.40 5.6 -2.5 19.7
-0.07 1.1 -0.568 3.4 -0.4 1.7 -2.4 6.4
-0.04 4.0 -0.534 1.5 -0.33 0.0 -2.2 1.8
-0.02 33.8 -0.489 12.1 -0.33 6.1 -2.2 3.1
0.02 0.2 -0.472 6.3 -0.32 18.8 -2.0 6.3
0.02 15.6 -0.457 1.7 -0.32 4.9 -1.6 4.1
0.06 3.1 -0.444 1.1 -0.3 1.4 -1.4 0.2
0.07 18.4 -0.409 1.5 -0.21 5.3 -1.1 10.6
0.09 18.8 -0.400 0.2 -0.21 12.4 -1.1 1.4
0.10 0.8 -0.399 1.1 -0.20 0.6 -0.9 0.8
0.12 0.0 -0.358 12.5 -0.18 18.4 -0.9 0.0
0.14 1.1 -0.347 5.6 -0.17 0.4 -0.9 1.4
0.14 1.6 -0.347 23.4 -0.16 4.7 -0.3 12.4
0.14 0.0 -0.343 17.5 -0.12 0.8 0.1 0.0
0.14 12.9 -0.332 0.0 -0.11 6.1 0.1 12.0
0.16 7.4 -0.303 0.0 -0.10 1.4 0.3 0.8
0.16 4.9 -0.288 4.1 -0.07 2.0 0.6 9.5
0.21 0.0 -0.249 2.0 -0.03 0.0 0.6 7.0
0.26 0.4 -0.246 2.6 -0.03 11.4 0.6 3.5
0.28 0.0 -0.240 0.2 0.01 7.4 0.6 1.0
0.29 1.0 -0.195 8.2 0.01 2.2 0.6 13.2
0.31 6.4 -0.183 0.0 0.04 2.0 1.1 0.4
0.34 24.1 -0.181 4.6 0.04 6.5 1.1 12.9
0.35 11.8 -0.181 0.2 0.05 1.2 1.3 10.5
0.38 0.8 -0.170 0.4 0.05 1.0 1.6 0.0
0.38 0.0 -0.163 7.7 0.06 5.7 1.6 0.9
0.39 16.0 -0.156 12.0 0.06 0.0 1.6 2.2
0.40 2.7 -0.154 0.0 0.07 0.0 1.8 15.6
0.41 7.6 -0.148 13.3 0.08 24.1 2.1 3.1
0.43 0.4 -0.116 5.0 0.09 0.0 2.1 0.1
0.47 0.0 -0.104 0.9 0.14 0.0 2.1 1.5
0.49 16.9 -0.085 2.4 0.16 7.3 2.2 5.1
0.50 3.7 -0.071 0.2 0.17 17.5 2.7 7.7
0.51 2.8 -0.057 1.4 0.19 10.9 2.7 5.0
0.53 4.6 -0.042 5.7 0.20 7.0 2.7 4.0
0.53 10.6 0.001 0.2 0.20 2.7 3.0 4.7
0.53 11.5 0.034 6.4 0.20 3.5 3.2 6.1
0.55 10.9 0.060 0.4 0.23 1.7 3.7 7.5
0.56 0.0 0.110 4.9 0.25 3.7 3.7 3.2
0.56 4.1 0.128 29.6 0.26 6.8 4.1 1.5
0.58 6.1 0.163 0.0 0.27 4.0 4.1 1.7
0.58 51.5 0.163 12.9 0.28 4.1 4.7 2.8
0.60 7.5 0.166 3.2 0.29 10.0 5.1 6.5
0.61 23.4 0.184 10.9 0.30 0.8 5.1 13.7
0.61 4.1 0.186 0.0 0.31 1.0 5.3 12.5
0.63 0.4 0.194 6.6 0.33 6.0 5.3 6.6
0.63 1.7 0.232 4.1 0.34 23.4 5.6 4.7
0.65 0.3 0.265 6.0 0.34 14.0 5.8 0.0
0.65 5.1 0.265 10.6 0.38 1.5 6.0 13.3
0.65 10.1 0.356 15.6 0.43 7.6 6.3 11.8
0.66 5.7 0.368 4.0 0.43 11.8 6.7 17.5
0.66 6.5 0.385 7.4 0.43 2.7 6.7 27.6
0.66 0.0 0.446 0.2 0.44 15.6 6.7 4.4
0.68 0.8 0.482 0.7 0.46 9.8 7.2 0.0
0.69 0.0 0.550 1.2 0.48 0.4 7.7 10.5
0.72 0.9 0.553 0.0 0.52 10.5 7.7 0.2
0.72 2.2 0.556 0.8 0.52 3.1 7.7 0.0
0.73 9.8 0.575 0.0 0.53 0.0 8.0 3.4
0.73 29.6 0.621 11.8 0.56 0.2 8.2 5.7
0.74 0.5 0.648 0.4 0.59 5.0 8.2 8.2
0.75 6.8 0.723 6.5 0.59 33.8 8.4 33.8
0.77 0.0 0.786 0.0 0.59 13.2 8.6 0.7
0.80 1.5 0.800 4.1 0.60 3.8 8.6 0.4
0.81 4.7 0.819 1.0 0.61 7.5 8.9 3.8
0.86 6.0 0.821 1.6 0.62 16.9 9.1 2.4
0.87 5.3 0.824 0.1 0.66 12.0 9.3 1.1
0.89 0.0 0.828 7.8 0.67 2.8 9.4 6.1
0.92 7.3 0.894 0.0 0.67 0.2 9.4 14.0
0.93 2.0 0.905 10.5 0.69 3.3 9.4 4.1
0.97 10.5 0.938 3.7 0.75 12.9 9.6 0.2
0.97 3.4 0.967 6.8 0.81 12.9 9.6 1.7
0.98 2.7 0.974 3.5 0.82 0.2 9.8 6.0
0.99 3.7 1.001 1.4 0.82 51.5 10.3 0.2
1.00 15.2 1.043 0.0 0.83 0.5 10.8 0.4
1.00 2.0 1.076 5.7 0.83 3.1 11.3 7.0
1.05 1.7 1.122 1.0 0.86 0.3 11.8 6.4
1.06 0.4 1.180 18.4 0.93 10.6 11.9 10.0
1.07 1.0 1.230 0.4 0.94 4.4 12.4 1.1
1.12 5.7 1.232 0.0 1.03 0.4 12.7 0.4
1.16 0.2 1.238 0.0 1.07 0.9 12.8 0.0
1.18 0.2 1.270 13.7 1.11 0.2 12.8 0.0
1.23 10.5 1.277 6.4 1.12 3.4 12.9 18.4
1.24 12.4 1.290 1.1 1.14 26.1 12.9 3.1
1.25 3.1 1.295 4.9 1.18 19.7 12.9 5.7
1.25 1.5 1.304 0.0 1.21 4.1 13.2 6.0
1.27 0.0 1.353 2.0 1.21 0.0 13.3 2.0
1.27 19.0 1.359 0.2 1.22 2.8 13.3 0.4
1.28 1.2 1.381 4.0 1.24 1.5 13.3 4.1
1.29 6.3 1.429 9.8 1.27 1.5 13.8 5.2
1.30 26.1 1.595 3.9 1.27 11.9 14.1 1.0
1.37 0.4 1.613 0.0 1.32 0.4 14.4 1.6
1.38 7.0 1.627 0.0 1.38 7.5 14.6 0.6
1.39 1.5 1.645 1.1 1.45 19.0 14.8 8.4
1.41 19.7 1.656 3.1 1.46 0.0 15.2 6.8
1.46 17.5 1.679 0.4 1.50 10.5 15.6 4.9
1.51 3.8 1.889 4.1 1.56 0.0 15.7 0.8
1.59 8.4 1.987 5.7 1.61 11.5 16.2 12.1
1.63 11.9 2.034 2.2 1.65 15.7 16.5 2.4
1.74 0.4 2.062 4.7 1.69 0.0 16.9 4.6
1.75 15.7 2.282 0.0 1.75 10.1 17.0 1.1
1.77 8.0 2.544 0.0 1.75 29.6 17.4 1.1
1.84 7.5 3.106 6.0 1.77 0.4 19.5 1.1
1.86 0.0 3.279 2.4 1.88 15.2 20.8 4.1
2.04 0.2 3.402 0.9 2.09 6.3 21.3 3.7
2.42 5.0 3.495 1.0 2.10 8.4 23.0 0.2

2015 Mark Sannutti

Results

The results for each of the eight cities in the study. Monthly values are listed first, followed by the Seasonal Statistics. To request the raw data that lead to the results, please contact me directly at mark.sannutti@noaa.gov

Monthly Statistics

Philadelphia, PA (KPHL)
Pattern X2 P-Value Result
NAO 12.4 0.015 Highly Significant
PNA 4.65 0.325 Insignificant
AO 12.8 0.012 Very Statistically Significant
PDO 14.9 0.005 Very Staticially Significant
AMO 3.97 0.410 Insignificant
SOI 8.60 0.072 Mildly Signficant
EPO 7.97 0.093 Mildly Significant
TNH 5.28 0.260 Insignificant


Washington, D.C. (KDCA)
Pattern X2 P-Value Result
NAO 9.23 0.056 Mildly Significant
PNA 7.67 0.104 Insignificant
AO 8.21 0.084 Mildly Significant
PDO 9.73 0.045 Mildly Significant
AMO 3.23 0.521 Insignificant
SOI 6.48 0.166 Insignificant
EPO 19.0 0.001 Very Statistically Significant
TNH 1.47 0.832 Insignificant


New York City (KNYC)
Pattern X2 P-Value Result
NAO 8.88 0.064 Mildly Significant
PNA 8.07 0.089 Mildly Significant
AO 7.20 0.126 Insignificant
PDO 11.6 0.020 Highly Significant
AMO 4.84 0.304 Insignificant
SOI 6.92 0.140 Insignificant
EPO 5.24 0.264 Insignificant
TNH 4.89 0.298 Insignificant


Boston, MA (KBOS)
Pattern X2 P-Value Result
NAO 3.34 0.503 Insignificant
PNA 7.53 0.110 Insignificant
AO 1.96 0.744 Insignificant
PDO 6.91 0.141 Insignificant
AMO 3.37 0.498 Insignificant
SOI 0.956 0.916 Insignificant
EPO 1.37 0.850 Insignificant
TNH 5.61 0.230 Insignificant


St. Louis (KSTL)
Pattern X2 P-Value Result
NAO 6.15 0.188 Insignificant
PNA 4.65 0.325 Insignificant
AO 10.3 0.036 Highly Significant
PDO 5.91 0.206 Insignificant
AMO 6.26 0.180 Insignificant
SOI 1.29 0.863 Insignificant
EPO 9.53 0.049 Highly Significant
TNH 1.18 0.881 Insignificant


Chicago, IL (KMDW)
Pattern X2 P-Value Result
NAO 4.41 0.354 Insignificant
PNA 3.30 0.509 Insignificant
AO 6.80 0.147 Insignificant
PDO 4.80 0.308 Insignificant
AMO 5.90 0.207 Insignificant
SOI 6.26 0.181 Insignificant
EPO 2.60 0.627 Insignificant
TNH 11.4 0.022 Highly Significant


Minneapolis, MN (KMSP)
Pattern X2 P-Value Result
NAO 7.94 0.094 Mildly Significant
PNA 6.41 0.171 Insignificant
AO 5.85 0.210 Insignificant
PDO 6.05 0.196 Insignificant
AMO 5.36 0.253 Insignificant
SOI 2.20 0.699 Insignificant
EPO 3.89 0.421 Insignificant
TNH 5.20 0.268 Insignificant


Indianapolis, IN(KIND)
Pattern X2 P-Value Result
NAO 8.04 0.090 Mildly Significant
PNA 2.99 0.560 Insignificant
AO 11.1 0.025 Highly Significant
PDO 3.29 0.511 Insignificant
AMO 4.60 0.331 Insignificant
SOI 2.86 0.581 Insignificant
EPO 12.5 0.014 Highly Significant
TNH 6.81 0.146 Insignificant


Seasonal Statistics

Philadelphia, PA (KPHL)
Pattern X2 P-Value Result
NAO 3.30 0.509 Insignificant
PNA 1.50 0.827 Insignificant
AO 8.70 0.069 Mildly Significant
PDO 11.0 0.027 Highly Significant
AMO 6.60 0.159 Insignificant
SOI 11.1 0.025 Highly Signficant
EPO 1.72 0.787 Insignificant
Nino 3.4 1.50 0.827 Insignificant


Washington, D.C. (KDCA)
Pattern X2 P-Value Result
NAO 4.45 0.348 Insignificant
PNA 2.67 0.614 Insignificant
AO 9.46 0.051 Mildly Significant
PDO 4.82 0.306 Insignificant
AMO 2.32 0.677 Insignificant
SOI 9.93 0.042 Highly Significant
EPO 1.64 0.801 Insignificant
Nino 3.4 3.49 0.479 Insignificant


New York City (KNYC)
Pattern X2 P-Value Result
NAO 4.80 0.308 Insignificant
PNA 9.60 0.048 Highly Significant
AO 10.2 0.037 Highly Significant
PDO 15.4 0.004/td> Very Statistically Significant
AMO 3.90 0.420 Insignificant
SOI 7.50 0.112 Insignificant
EPO 4.45 0.348 Insignificant
Nino 3.4 3.90 0.420 Insignificant


Boston, MA (KBOS)
Pattern X2 P-Value Result
NAO 0.791 0.940 Insignificant
PNA 6.38 0.172 Insignificant
AO 6.89 0.142 Insignificant
PDO 3.28 0.512 Insignificant
AMO 4.15 0.386 Insignificant
SOI 6.16 0.188 Insignificant
EPO 3.21 0.523 Insignificant
Nino 3.4 3.24 0.518 Insignificant


St. Louis (KSTL)
Pattern X2 P-Value Result
NAO 1.72 0.787 Insignificant
PNA 2.33 0.676 Insignificant
AO 2.92 0.571 Insignificant
PDO 4.92 0.296 Insignificant
AMO 2.35 0.671 Insignificant
SOI 4.01 0.405 Insignificant
EPO 2.02 0.731 Insignificant
Nino 3.4 0.491 0.974 Insignificant


Chicago, IL (KMDW)
Pattern X2 P-Value Result
NAO 6.13 0.190 Insignificant
PNA 2.05 0.726 Insignificant
AO 3.44 0.488 Insignificant
PDO 1.59 0.811 Insignificant
AMO 3.44 0.488 Insignificant
SOI 13.0 0.011 Very Statistically Significant
EPO 6.43 0.169 Insignificant
Nino 3.4 17.2 0.002 Very Statistically Significant


Minneapolis, MN (KMSP)
Pattern X2 P-Value Result
NAO 3.84 0.428 Insignificant
PNA 1.44 0.838 Insignificant
AO 1.95 0.745 Insignificant
PDO 5.61 0.230 Insignificant
AMO 5.81 0.214 Insignificant
SOI 5.63 0.229 Insignificant
EPO 5.13 0.275 Insignificant
Nino 3.4 5.52 0.238 Insignificant


Indianapolis, IN(KIND)
Pattern X2 P-Value Result
NAO 3.00 0.558 Insignificant
PNA 1.20 0.878 Insignificant
AO 4.20 0.380 Insignificant
PDO 5.04 0.283 Insignificant
AMO 2.40 0.663 Insignificant
SOI 6.90 0.141 Insignificant
EPO 8.06 0.089 Mildly Significant
Nino 3.4 11.1 0.025 Highly Significant

2015 Mark Sannutti

Analysis and Discussion

There are two observations that stand out in the results. Statistical significance was stronger for monthly snowfall compared to seasonal snowfall. The AO and PDO showed the most significance overall versus the other patterns, while the PNA and and AMO were the least. Both Boston and Minneapolis showed no significance whatsoever in any of the patterns. They were also the furthest north in latitude. On a synoptic scale, the phase of each of the patterns can have a big impact. This can affect both storm track and precipitation type, which will affect snowfall. Independently, the patterns show no effect on snowfall compared to locations futher south.

The next two paragraphs will focus on the results for city of Philadelphia, as it cleary stood out over the other cities because of high statistical significance for several patterns. With five winter seasons to compare, the results verify nicely with the conditions that have occured to date. Despite a borderline high La Nina during the 2010/2011 winter season, there was much above average monthly and seasonal snowfall, totaling over 44 inches. In my opnion, the dominance of the negative phase of the AO during that winter was the only reason for the result. To backup that claim, the winter of 2009/2010 also saw a domiant negative AO of record levels, resulting in high monthly snowfalls and two historic snowstorms. One could argue that there was moderate El-Nino that winter contributing to the result. While it likely did contribute, the AO contributed mostly to the massive snowstorms leading to the high snowfall that winter. The results in this study are evidence for support and the montly data for the AO is shown in Table 1.

Table 1 - Arctic Oscillation for Philadelphia, PA(Monthly)

Thresholds Low: -4.266 to -1.046 Medium: -1.036 to 0.186 High: 0.194 to 3.495
      Index Value
      LOW MEDIUM HIGH TOTAL
Total Snowfall 7.3 - 51.5 26(17.7) 18(17.7) 9(17.7) 53
(inches) 2.4 - 7.0 17(17.7) 16(17.7) 20(17.7) 53
0 - 2.2 17(24.7) 26(24.7) 31(24.7) 74
    Total 60 60 60 180
             
X2=12.8   P-Value= 0.012 Very Statistically Significant

However, the winter of 2014/2015 saw a dominant positive AO. Snowfall was high in February, but not in December or January. There was also a record postive PDO. Since both patterns were both very statistically significant, there was a battle for superiority. A positive AO lacks snowfall, while a postive PDO increases snowfall. The winter saw a lack of snowfall in December and January, while February saw more snow. In fact, it was only the 10th occurance of double digit monthly snowfall with high positive AO values since 1950 (See Table 1). One key event that backed up the results of the AO was during the January 26-27, 2015 historic blizzard that hits parts of Southern New England from Long Island to Boston. The storm was a major bust for Philadelphia. The results showed from a statiscial standpoint that Boston(p-value=0.744)and New York City(p-value=0.126) could see major to historic snowstorms with this type of pattern, but not Philadelphia (p-value 0.012). The monthly data clearly showed that big snowfalls don't occur often when the AO is in the positive phase. The values of the AO during this event were greater than '1', easily putting them in the high(postive) category. 
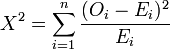
The differences between a postive and negative AO can be shown synoptically. Two snow events are shown. Figure 1 is from the December 18-19, 2009 event where there was a 
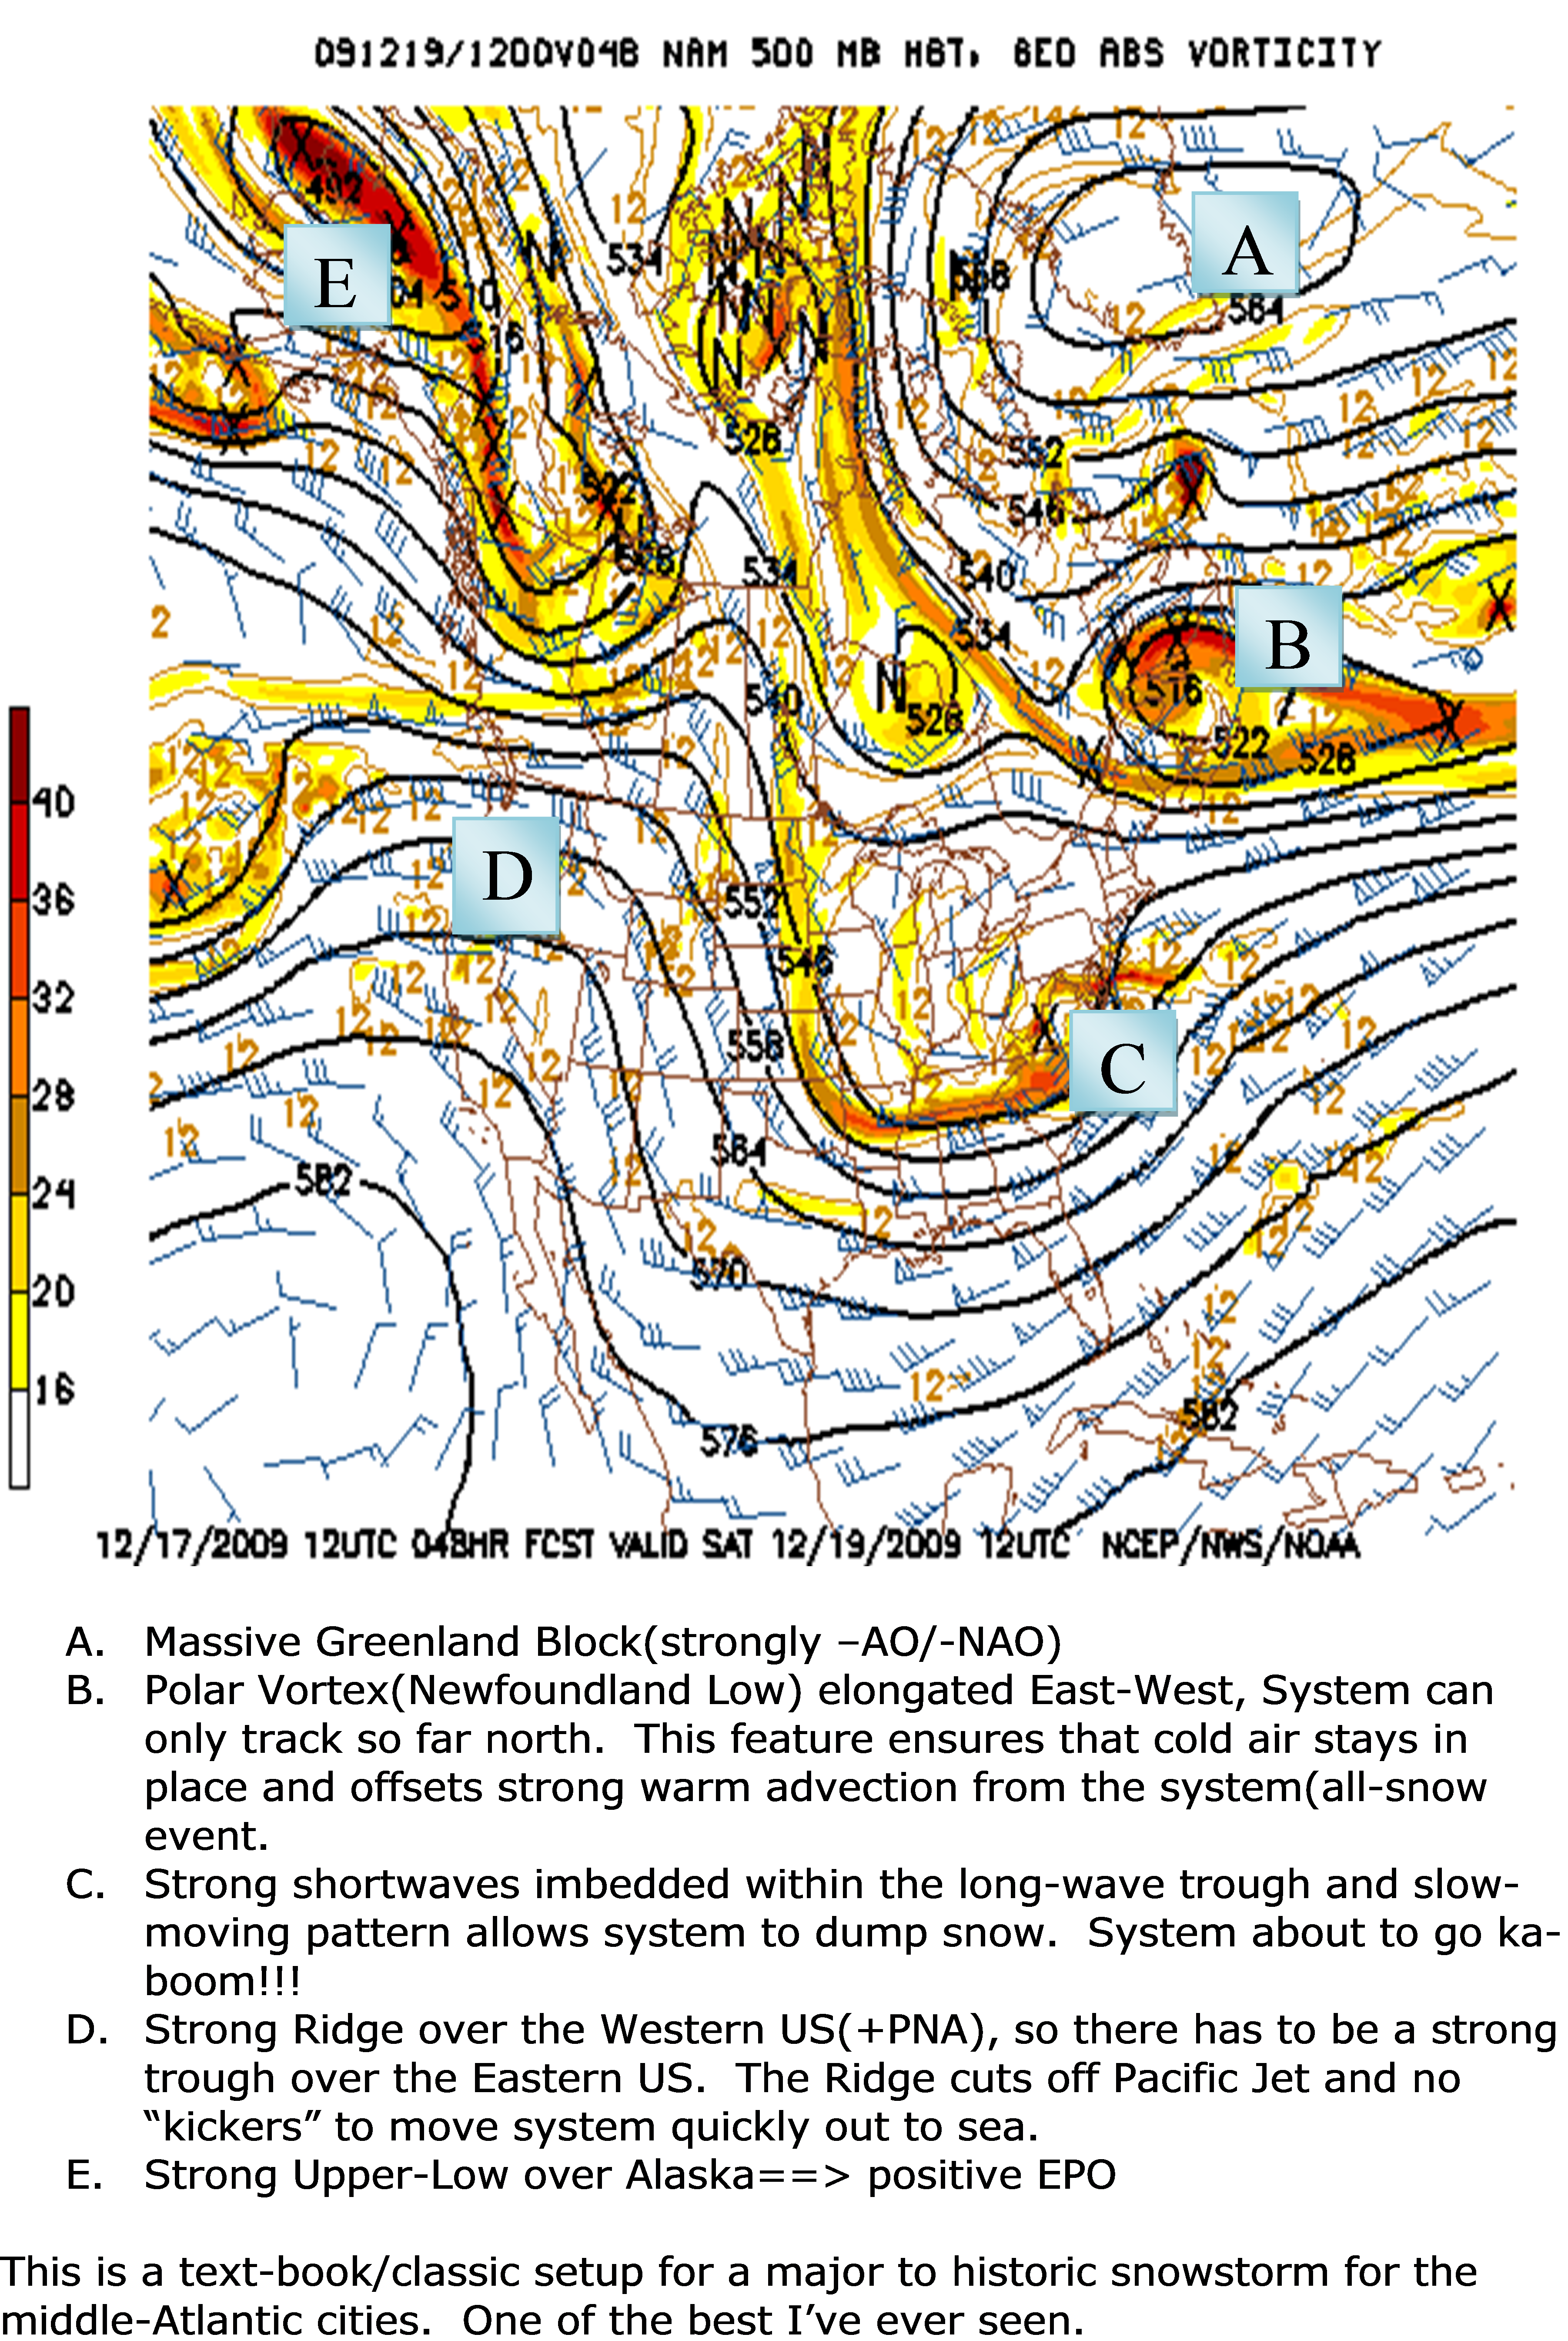
strong negative AO, with 23.2 inches of snow that fell on the city. The map is from the 12Z NAM on Dec. 17, 2009. Figure 2 is from the January 26-27, 2015 event where there was a strong postive AO and only 1.2 inches of snow fell on the city. The map is from the 00Z GFS on January 26. In both images, note the strong ridge on the West Coast of the U.S. and the deep trough on the East Coast. This is a very good example showing Newton's Third Law of every action has an equal and opposite reaction. **Click on images to enlarge and open in a new tab**

Figure 1 Figure 2
Image Courtesy of NCEP Image Courtesy of Tropical Tidbits

The strongest significance for ENSO occurred with the city of Chicago. The p-values were very statistically significant for seasonal values. This was for both the Nino 3.4 and SOI values. A high number of seasonal snowfall totals occured for high Nino 3.4 values and low SOI values. This indicates stronger emphasis should be placed on El Nino events over Neutral or La Nina conditions. This verified for the winter of 2014/2015 where high monthly snowfalls occurred during January and February with weak El-Nino conditions. Prior years showed mixed results. The data did show lower seasonal snowfalls during La Nina events. This verified during the 2011/2012 winter, but was a big failure during the winter of 2010/2011. Indianapolis showed strong significance for seasonal values, but only for the SOI. The same was noted for Philadelphia and Washington, D.C.

The TNH pattern was used for monthly statistics over the Nino 3.4 due more volatile short term changes. Sea-surface temperatures can remain fairly constant for several months over the equatoria Pacific ocean and thus the need to find any significance would be stronger on a seasonal scale. Only the city of Chicago saw significance with the TNH pattern. And it was strong. The data favored higher snowfall during a positive phase. There was a very strong +TNH pattern during the winter of 2013/2014 and that verified 
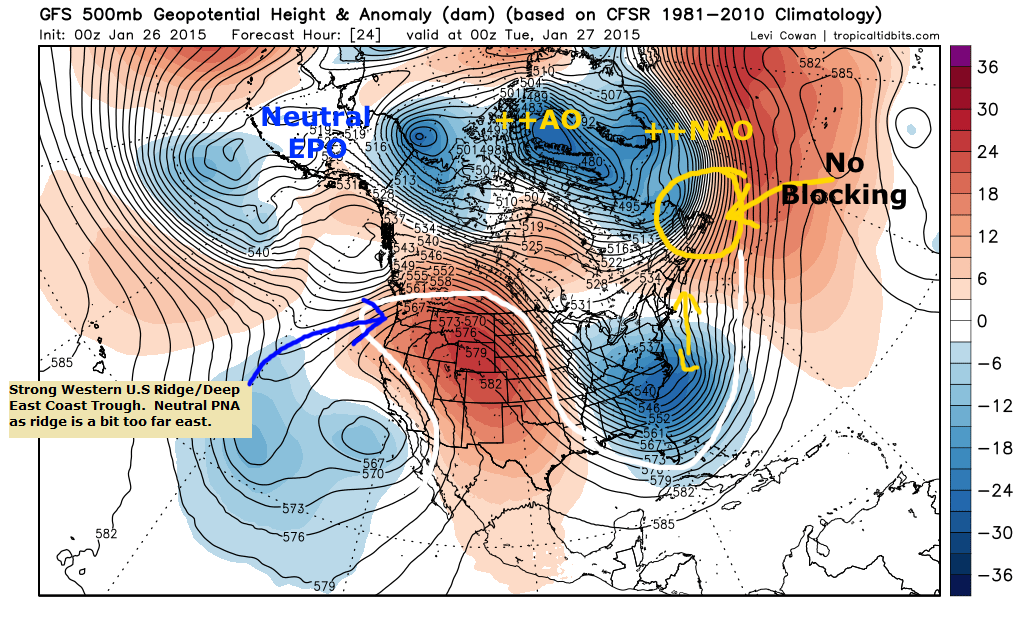
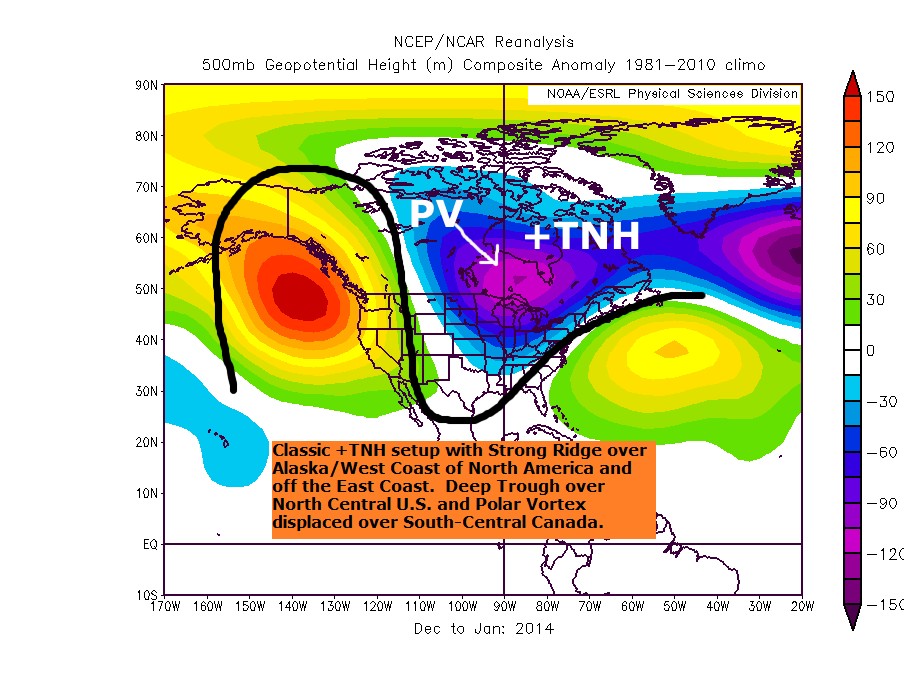
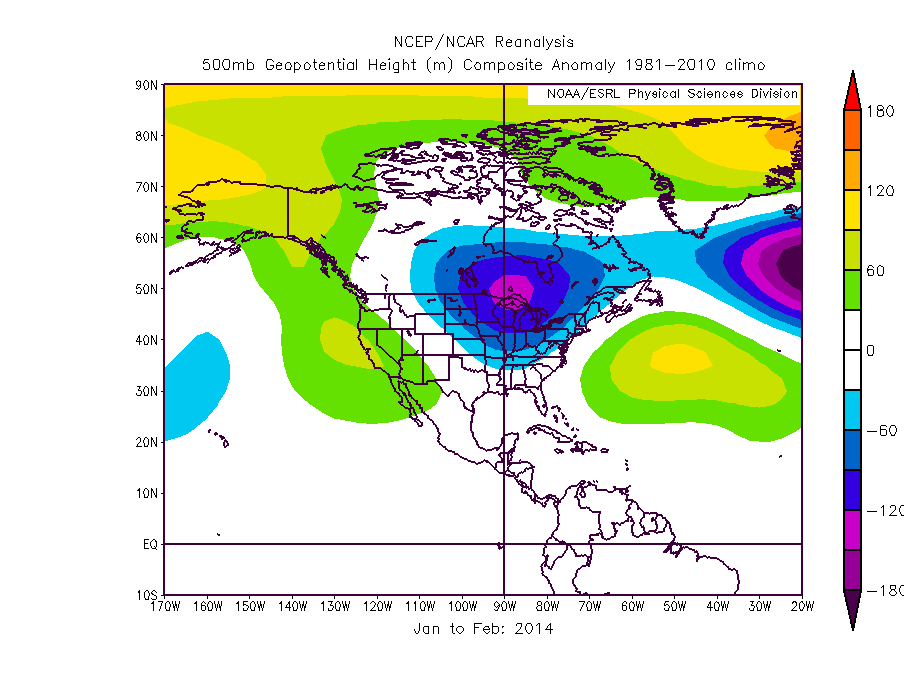
extremely well as Chicago saw one of the coldest and snowiest winters on record. Figures 3a and 3b show the 500mb height anomalies, averaged over two months. Figure 3a is averaged for Deccember 2013 and January 2014, while Figure 3b is the average for January and February 2014. The snowfall during those three months was in the top five for Snowiest winters on record. Table 2 shows that over half of the total number of high monthly snowfalls occured with high(positive) values of the TNH.

Figure 3a Figure 3b
Image Courtesy of ESRL Image Courtesy of ESRL

Table 2 - Tropical-Northern Hemisphere Pattern for Chicago, IL(Monthly)

Thresholds Low: -3.26 to -0.41 Medium: -0.40 to 0.36 High: 0.39 to 2.14
      Index Value
      LOW MEDIUM HIGH TOTAL
Total Snowfall 12.9 - 41.3 15(17.7) 15(17.7) 30(17.7) 60
(inches) 2.4 - 7.0 23(17.7) 24(17.7) 14(17.7) 60
0 - 2.2 22(24.7) 22(24.7) 16(24.7) 60
    Total 60 60 60 180
             
X2=11.4   P-Value= 0.022 Highly Significant

The EPO showed significance for a few cities, but only for monthly snowfall. The highest significance was seen for Washington, D.C. The data was very strong. In fact, it was the strongest significance seen in the entire study. This was due to very few moderate or high snowfall totals during a low(negative EPO). Roughly 67% of all monthly snowfalls during the low phase of the EPO were in the 'low' category (less than 2 inches total). The data is shown in Table 3. This was a very interesting find. None of the other major cities along the East Coast saw this result and only Phialdephia saw mild significance.

Table 3 - Eastern Pacific Oscillation Pattern for Wasington, DC(Monthly)

Thresholds Low: -2.60 to -0.55 Medium: -0.54 to 0.28 High: 0.36 to 3.18
      Index Value
      LOW MEDIUM HIGH TOTAL
Total Snowfall 6.2 - 32.1 11(17.7) 17(17.7) 21(17.7) 60
(inches) 1.9 - 5.9 8(17.7) 19(17.7) 22(17.7) 60
0 - 1.8 40(24.7) 24(24.7) 17(24.7) 60
    Total 45 50 81 180
             
X2=19.0   P-Value= 0.001 Very Statistically Significant

Other cites that saw stromg significance on a monthly scale were Indianpolis and St. Louis. Of the three cities, only Indianapolis saw any signficance on a seasonal scale.

2015 Mark Sannutti